Lesson 1: Sketching and Interpreting Graphs
Module 4: General Relations
Explore

© Rohit Seth/shutterstock
Soaking in a hot tub is a good way to relax after strenuous exercise or to finish off a long day. The water relieves muscle tension and reinvigorates the body.
The level of water in a hot tub is fairly constant. Of course, the water level changes when the tub is being filled and when it is drained. In addition, the water level rises as people get into the tub and drops as they get out. This level change is due to the displacement of water. You can track the water level of a hot tub on a graph.
In this lesson you will learn about independent and dependent variables. You will also learn how to describe a scenario to fit a graph, and you will sketch a graph to fit a description.
Glossary Terms
Add the following terms to your "Glossary Terms" in your notes. You may also want to add examples that demonstrate how each of these terms is applied:
-
dependent variable
-
distance-time graph
-
independent variable
-------------------------------------------------------------
Independent and Dependent Variables
A graph is usually constructed on a coordinate plane consisting of a vertical axis, or y-axis, and a horizontal axis, or x-axis. The graph will show the relationship between two variables—the independent variable and the dependent variable.
The independent variable is the quantity that is not dependent on the other variable. The independent variable is also the variable for which values are selected.
The dependent variable is what changes when the independent variable changes. In other words, the dependent variable depends on the outcome of the independent variable. It is the variable that reflects the influence of the independent variable.
 Watch and Listen
Watch the video titled “Graphic Representations”.

This video shows an example of how you can interpret the independent and dependent variables in a given context. As you watch the video, focus on where the independent variable and dependent variable are placed on a graph.
Example
Isabel designs an experiment to measure the growth rate of plants. She exposes two different groups of plants to different amounts of sunlight per day. One group receives 8 hours of sunlight per day, and the second group receives only 4 hours of sunlight per day. Isabel monitors the growth of the plants in each group over a period of one month by recording the heights of the plants on a daily basis.
Identify the independent and dependent variables in the scenario.

left: © Elnur/shutterstock, middle: © Andresr/shutterstock,
right: © Marcin Balcerzak/shutterstock
Solution
The independent variable is the duration of sunlight exposure. The dependent variable, or the variable that depends on the number of hours of sunlight exposure, is the growth of the plants.
 Read
Read
In your textbook you will find brief definitions of independent and dependent variables. As you read this short section in the textbook that you are using for this course, pay attention to how independent and dependent variables are recorded in a table.
Foundations and Pre-calculus Mathematics 10 (Pearson)
Read the text and the table at the top of page 267.
 Self-Check
Identify the independent and dependent variables in each scenario.
SC 1. Imagine you wish to know whether studying with a partner will increase your exam scores. You randomly assign each participant in this experiment to either an experimental condition or a control condition. In the experimental condition, participants study in pairs. In the control condition, the participants study by themselves.
SC 2. Now imagine you wish to know whether a one-page or a two-page resumé is more persuasive. You randomly assign each participant to read a one-page or two-page resumé, and then they make a judgement about whether the person should be hired for a job.
 Tip
Tip
One way to distinguish between an independent variable and a dependent variable is to try making a sentence using the variable names.
(Studying with Others) causes a change in (Exam Score), and it isn’t possible that (Exam Score) could cause a change in (Studying with Others).
You see that “Studying with Others” must be the independent variable and “Exam Score” must be the dependent variable because the sentence doesn’t make sense the other way around.
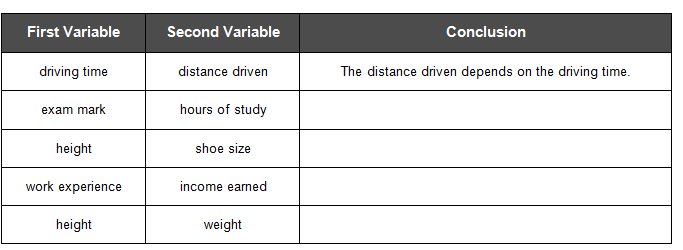
 Try This 10
Complete the following in your course folder ( binder).
Compare the variables in each pair. Decide which quantity depends on the other. The first row has been done as an example.
Use the link below to check your answers to Try This 10.