Lesson 1: Sketching and Interpreting Graphs
Interpreting Graphs
Graphs are a great way to present information visually. A well-constructed graph can be a source of information that is easy to read and understand and is also pleasing to the eye. The patterns in a graph, however, still need to be interpreted correctly in order for it to be useful. Interpreting graphs is a skill that requires some practice. The next part of this lesson focuses on interpreting graphs.
Example
Consider this scenario: Jasmine pedals her bicycle up a hill and then down the other side of the hill.

For each of the following pairs of graphs, decide which graph best represents the scenario. State reasons to support your answer.
- Which of the following height vs. time graphs would best represent the scenario?

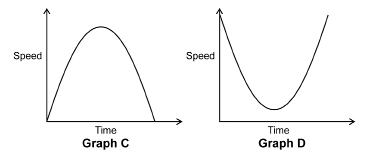
- Which of the following speed vs. time graphs would best represent the scenario?
Solution
- As Jasmine pedals uphill, her height relative to her starting position increases. Once she reaches the top, Jasmine then begins to descend downhill. Therefore, the graph that shows an increase followed by a decrease is Graph A.
- As Jasmine pedals uphill, her speed decreases since gravity is working against her and slowing her down. As Jasmine moves downhill, her speed increases since gravity is working with her. Therefore, the graph that shows a decrease followed by an increase is Graph D.
|

 Watch and Listen
Watch the “Interpreting Graphs” video below to see some solved examples.

Describe a Scenario to Fit a Graph
 Try This 11 - 15
Complete the following in your course folder ( binder).
TT 11. Consider the graph shown. Create a scenario to describe what is happening in the graph. Be sure to account for each line segment in the graph. You are free to add any extra details.

AB: _________________________________________________
BC: _________________________________________________
CD: _________________________________________________
TT 12. In your scenario, how far apart are points A and D? (You may want to add a scale to each axis to provide more detail to your scenario.)
TT 13. Sections AB and CD are both diagonal line segments, but one is steeper than the other. How does your description account for the difference?
TT 14. How should a horizontal segment such as BC be interpreted in a distance-time graph?
TT 15. How would the scenario you described be different if the label on the vertical axis was changed to “Speed”?
Use the link below to check your answers to Try This 11 - 15.
 Read
Read
In your textbook you will find an example demonstrating how to interpret the various parts of a distance-time graph. As you read, see if you can determine the answers to the following questions.
Foundations and Pre-calculus Mathematics 10 (Pearson)Read “Example 2: Describing a Possible Situation for a Graph” on page 279. How can you explain the difference in the length of segment AB compared to segment CD? What is the relationship between the start point and point E? How do you know? |
Mathematics 10C Learn EveryWare © 2010 Alberta Education