Lesson 2: Relations
Module 4: General Relations
Explore

© Eureka/Alamy
A tennis ball cannon is an invaluable tool that can help tennis players improve their groundstrokes, smashes, and slices. The machine is pre-loaded with up to 200 tennis balls. The cannon then shoots the tennis balls toward the player at a constant rate. The speed and trajectory of the ball as it comes out of the cannon can be programmed by the player. A few seconds later, another ball is shot out of the cannon to enable the tennis player to continue practising without having to retrieve the ball after each stroke.
In mathematics, a relation is similar to a machine such as the tennis ball cannon. Relations are rules that associate input values to output values. Just as the tennis machine can take a ball and give it speed and height, so can a relation convert input values into output values. You will focus on learning different ways to express the input and output values. You will also apply these principles to graphing.
Glossary Terms
Add the following terms to your "Glossary terms". You may also want to add examples that demonstrate how each term is applied.
-
continuous data
-
discrete data
-
domain
-
interval notation
-
range
-
relation
-
set notation
------------------------------------------------------------------
 Watch and Listen
You can begin this lesson by watching the “Relations” video to gain an overview of what relations are and how you can describe the properties of relations. As you watch, count the number of ways that you can represent relations. To watch the video, use the link below: **Scroll down to find the video**

A relation is a rule that relates the elements of one set of values to the elements of a second set of values. You can think of a relation as a set of ordered pairs, although there are many other ways of representing a relation. You can represent a relation as a table, an arrow diagram or mapping, or a graph. The following example will show several ways to represent the relation from the Discover section.
Example
Recall your work in TT 1 to TT 6 from the Discover section. Show how you can represent the relation in your answers in the following ways:
-
table of values
-
arrow diagram or mapping
-
ordered pairs
-
graph
Solution
Table of Values
In TT 1 you were asked to complete a table relating the figure number to the number of tiles in the border of a design. Your completed table is one way to represent a relation.
The numbers in the first column are related to the numbers in the second column.
Arrow (or Mapping) Diagram
An arrow diagram, or mapping, is similar to a table but has arrows pointing from each input value to the corresponding output value.
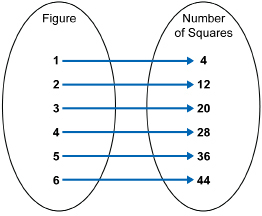
Ordered Pairs
A relation can be expressed as a set of ordered pairs of the form (input, output). In this case, the set is {(1, 4), (2, 12), (3, 20), (4, 28), (5, 36), (6, 44)}. The first coordinates are the numbers from the first column ( input) and the second numbers are the coordinates from the second column ( output).
Graph
The graph that you constructed in the Discover section is yet another way to represent a relation.
You may want to print and use one of either Representing Relations Template 1 or Representing Relations Template 2 to organize your information.
Discrete vs Continuous Data
The graph of a relation can be either discrete or continuous.
Where the values between graphed points have meaning in the context of the question, the data is continuous. In this case, it would be appropriate to join the points with a line or a smooth curve. For example, if you constructed a graph relating the height of a growing plant over time, you would get a continuous graph. This is because all values of both height and time are meaningful. It is possible to have a height of 10 cm, 11 cm, and all values between 10 cm and 11 cm.
On the other hand, where the values between points have no meaning in the question’s context, the data is discrete. It is not appropriate to join the points on a discrete graph. Discrete data include those data you can count. For example, if you graphed the number of people in a store over a period of a business day, you would get a discrete graph. This is because not all real values are meaningful in this context. While it is possible to have 10, 11, or 12 people in the store, you cannot have 10.5 or 11.777 people in the store!
 Tip
Tip
A simple way to identify a situation as being discrete or continuous is to ask yourself whether or not the independent and dependent variables can have values that are between whole numbers, such as 6.25.
For example, a distance-time graph would be an example of a continuous graph since both distance and time can have values between whole numbers. It is possible to have a time value of 6.25 seconds or 6.25 years, and it is also possible to have a distance value of 6.25 m or 6.25 yd.
On the other hand, a graph showing the number of cars sold per year is discrete since you cannot sell 6.25 cars.
 Try This 13
Retrieve Try This 1 - 12 from the Discover section of this lesson.
TT13: Compare the two graphs you created in TT3 and TT8, and decide which one is discrete and which one is continuous. Be sure to provide support for your answer (do this right on the Try This 1 - 12 pages your printed). If necessary, modify your original response based on this new knowledge.
Watch and Listen
Watch “Discrete Data and Continuous Data” see examples of graphs of both continuous and discrete data.

Try This 14
Complete the following in your course folder ( binder), showing all work. Practice graphing data and identifying whether the graph depicts discrete or continuous data. The work may be descriptive or mathematical. You may want to review relevant parts of the lesson as you work through the problems.
Foundations and Pre-calculus Mathematics 10 (Pearson)
TT 14. Complete “Exercises” questions 10 and 11 on page 295 and question 21.a) on page 297.
Use the link below to check your answers to Try This 14.
Possible TT14 (Try This 14) Solutions