Lesson 5: Slope as a Rate of Change
Module 4: General Relations
Explore

© SVLumagraphica/shutterstock
Running in a cross-country race or a marathon is very different from running in a sprinting event. Besides being different distances, the strategy that an athlete brings to each type of race is also different. Unlike short-distance races where you want to run as fast as you can from start to finish, you need to run at a steady pace in order to succeed in a long-distance race. In these cases, a long-distance runner needs to balance energy conservation with holding a good position amongst the other competitors.
For these reasons, the speed of a long-distance runner is fairly constant throughout the race. The progress of a long-distance runner can be modelled by a relatively straight line on a distance-time graph.
In this lesson you will learn how to interpret the slope as a rate and how to use the slope and another point to predict other values along the graph.
Glossary Terms
Add the following term to your "Glossary term" section in your notes.
- rate of change
-------------------------------------------------------------------
The slope of a line is constant. Regardless of which pair of points on a line is used to calculate slope, the result will be the same. If you know the slope of a line and a point on that line, then you can do the following:
-
Find other points on the line.
-
Draw the line.
![]() Try This 1 - 2
Try This 1 - 2
Print (or copy by hand) and complete the following in your course folder ( binder).
Use the link below to check your answers to Try This 1 - 2.
Possible TT1- 2 (Try This 1- 2) Solutions
The following example shows a similar question to the one you just completed. Compare the solution in this example to the method you used.
Example
A line passes through the point (–2, –5) and has a slope of 3.
- Determine two other points on the line.
- Sketch the line.
Solution
- To determine the rise and run of a slope of 3, write the slope as a fraction.
Step 1: Determine the rise and run of the slope.
slope = 3
Therefore, the rise is 3 and the run is 1.
Step 2: Graph the point (–2, –5). Then apply a rise of 3 units up and a run of 1 unit to the right to find another point on the line. The second point will have coordinates (–1, –2).
Since , you could also apply a rise of –3 and a run of –1. In other words, you could also move down 3 units and left 1 unit.
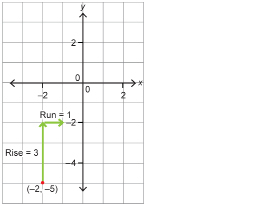
Step 3: Since the slope of a line is constant, you can find additional points by applying the rise and the run to each new point. A third point found in this way is (0, 1).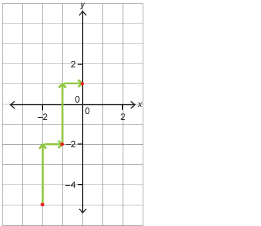
- Use a straightedge to connect the points on the graph with a line.
 Tips
Tips
1. You only need two points to construct a line, but you can improve the accuracy of the line by using more than two points. Or you may use two points that are separated by a greater distance.
In either case, you would have to apply the rise and run more than once.
2. Double check that your line has the right slope by remembering that lines with
a positive slope, rise to the right and
a negative slope, fall to the right.
 Watch and Listen
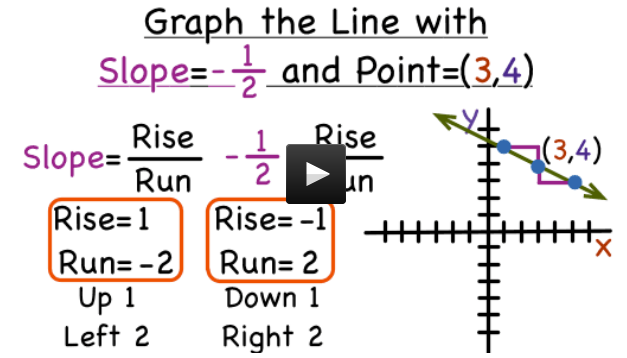
Watch the following short video clips to confirm that you understand how to plot a line given a point and the slope of the line.
Now watch the “Slope of a Line” video to review the concepts of slope that you learned in Lessons 4 and 5 of this module. The context of the video is based on going to a carnival. ** Scroll down to find the video** . You have previously viewed segments of this video.

 Self-Check
For each of the following self-checks, make a graph of a line through the given point with the given slope.
SC 1. A point at (–3, 2) and a slope of ![]()
SC 2. A point at (5, 6) and a slope of ![]()
SC 3. A point at (–4, –3) and a slope of –2.
![]() Try This 3
Try This 3
Complete the following in your course folder ( binder).
Foundations and Pre-calculus Mathematics 10 (Pearson)
TT 3. Complete “Exercises” questions 9.c), 9.d), 23.b), and 23.d) on pages 340 and 341.
Print the provided grid page to graph.
Grid page
Use the link below to check your answers to Try This 3.
Possible TT3 (Try This 3) Solutions
|
A vertical intercept is where the line crosses the vertical axis. This is often referred to as the y intercept. |

Slope as a Rate of Change
The slope of a line shows how the vertical quantity on a graph changes as the horizontal quantity changes. The slope is the constant rate of change. You can determine this rate of change by evaluating any two points on the line by dividing the change in the vertical measure by the change in the horizontal measure.
Retrieve your results from Math Lab: Analyzing Slope. In the lab, you analyzed a distance-time graph representing the running times of a 4 × 200 m relay team. You constructed a straight line connecting the first and last points on the graph. You may have discovered that this line represents the average speed of the relay team. The slope units will help you to determine what the slope represents.
In the Math Lab, you may have calculated the slope in this way:
By looking at the slope units, you will know that this value is a measure of speed.
![]() Read
Read
In the following example, you will determine and interpret the slope in a different context. Look for the answer to the following question as you work through the example.
Foundations and Pre-calculus Mathematics 10 (Pearson)
Read “Example 4: Interpreting the Slope of a Line” on pages 338 and 339. What other information can you calculate once you have determined the rate of change?
![]() Self-Check
Self-Check
Try the following Self-Check questions to ensure you understand how to evaluate the slope of a line and interpret the slope as a rate of change. In these questions you will also be using the rate of change to predict other values in the context of the question.
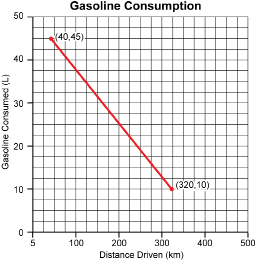
The graph shows the amount of gasoline remaining in the fuel tank after a vehicle has been driven certain distances. You will use this graph to answer SC 4, SC 5, and SC 6.
SC 4. What is the slope of the line through these points? Include units.
SC 5. What rate of change does the slope represent?
SC 6. Explain how the rate of change in SC 5 can be used to determine the following.
- How far can the vehicle be driven before it runs out of gas?
- What is the maximum capacity of the gas tank?
![]() Try This 4
Try This 4
Complete the following in your course folder ( binder).
Foundations and Pre-calculus Mathematics 10 (Pearson)
TT 4. Complete “Exercises” questions 25, 26, and 27 on page 342.
There is a grid provided for 25.
Use the link below to check your answers to Try This 4.