Lesson 1: Identifying Linear Relations
Module 5: Linear Functions
 Self-Check 1
In the following Self-Check question, see if you can come up with at least two different strategies for determining whether a set of ordered pairs is linear. Once you have tested your strategies, check your work.
SC 1. Using two different methods, determine whether the set of ordered pairs S = {(−2, 8), (6, −4), (2, 2), (8, −7)} represents a linear relation.
Retrieve your results from Part B of the Math Lab.
Consider your response to this question: How can you tell from an equation whether its graph will be a straight line or not?
Another way to phrase this question is to ask: How can you tell whether an equation represents a linear or non-linear relation?
The following are three ways that you can identify an equation as a linear relation. Compare the following methods with your own.
Method 1: Table/Graph
Choose four or five values for the independent variable. Record these values in a table. Calculate the corresponding values of the dependent variable for the selected values of the independent variable. Record these values in the table. Graph the relation based on the table. If the graph reveals points along a straight line, then the relation is linear.
Method 2: Equation Form
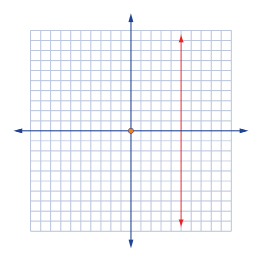
If the equation is in the form y = mx + b, where m and b are real numbers, then the equation is a linear relation. Also, if the equation takes the form of x = b, where b is a real number, then it is also a linear relation.
Method 3: Degree of Equation
If the equation consists of one or two variables and is a first-degree equation, then it represents a linear relation.
 Read
Read
Foundations and Pre-calculus Mathematics 10 (Pearson)
Go to your textbook and read “Example 2: Determining Whether an Equation Represents a Linear Relation” on page 304 to see how relations expressed as equations can be identified as linear or non-linear. As you read, try to answer the following questions:
-
Which method is used to identify linear relations?
-
How are the relations y = 5 and x = 5 different?
As you discovered from previous lessons, a relation can be expressed in many ways. In Lesson 1 so far, you have examined linear relations expressed as graphs, tables, ordered pairs, and equations. One final method of describing a relation that will be examined in this lesson is the use of words. A relation can also be a description of a situation.
In these cases, how can you identify whether it’s a linear relation?
 Share 1 - 3
Complete the following questions in your course folder binder and then compare your answers with another classmate or appropriate partner ( if possible). Record any similarities and differences you discussed. Use the provided link to check your work.
The following situations represent relations that are linear and non-linear. Apply the techniques you have learned in this lesson to determine whether the relation is linear or non-linear, and explain how you know. Provide supporting explanations and/or show the steps you followed to arrive at your conclusions. Include in your response a discussion of what the key difference is between linear and non-linear situations.
1. The cost of downloading songs from a music website is $1.29 per song. The total cost of downloading songs is related to the number of songs downloaded.
2. Dennis invests $200. Every year, the value of the investment increases by 10%. The value of the investment is related to time.
3. The cost of hosting a fundraising dinner is $500 to rent the hall, plus $25 per person. The total cost of the event is related to the number of people that attend.
 Self-Check 2
You have now learned to recognize linear relations in their different forms from graphs to words. The following Self-Check questions will give you the chance to test your ability to identify linear and non-linear relations when they are described in various forms.
SC 2. Identify each of the following relations as linear or non-linear. Provide support for your answer.
-

x
y
0
4
1
8
2
12
3
16
4
20
5
24
- S = {(15, 13), (20, 17), (5, 9), (10, 11)}
- y = x
- The number of bacteria in a sample doubles every two hours. The number of bacteria is related to time.
 Try This 5
Complete the following in your course folder ( binder).
Foundations and Pre-calculus Mathematics 10 (Pearson)
TT 5. Complete “Exercises” questions 3, 4, 5, 6, 16, and 17.a) on pages 308 to 310.
Use the link below to check your answers to Try This 5.