Lesson 2: Properties of Linear Functions
Module 5: Linear Functions
Recall the concepts of domain and range you learned in Module 4. Recall that the domain is the list of all values of the independent variable and that the range is the list of all values of the dependent variable. The following Share exercise will help you understand the domain and range of linear relations.
 Share 8 - 12
Print (or complete by hand) Share 8 - 12 and work with a partner ( if possible) to complete them.
Share 8 - 12
Now check your work using the link provided.
Possible S8-12 ( Share 8 - 12) Solutions
 Read
Read
In previous lessons you learned about the slope of a linear relation.You learned in this lesson about a linear relation’s intercepts, domain, and range. These concepts are meaningful in real-world situations.
Work through the following examples to see how to interpret the graph of a linear relation in specific contexts. Pay particular attention to instances where the domain and range of a linear function are restricted. Try to see if you can discover the reason for each restriction.
Foundations and Pre-calculus Mathematics 10 (Pearson)Read “Example 1: Determining Intercepts, Domain, and Range of the Graph of a Linear Function” on page 314. |
 Self-Check 2 - 4
See how well you know the properties of linear functions by completing the following questions.
A long distance phone company charges a recurring fee of $12/month and $0.10 per minute on long distance phone calls. The total bill for the month can be represented by the equation C = 0.10n + 12, where C represents the total cost of the bill and n represents the number of minutes tallied for that month.
SC 2. Sketch the graph of the equation.
SC 3. Following are two sets of statements that refer to this context.
a. Select the true statement and give reasons to support your answer.
A. The slope represents the number of minutes used.
B. The slope represents the recurring monthly charge.
C. The slope represents the cost per minute.
D. The slope represents the amount of the total bill.
b. Select the true statement and give reasons to support your answer.
A. The y-intercept represents the number of minutes used.
B. The y-intercept represents the recurring monthly charge.
C. The y-intercept represents the cost per minute.
D. The y-intercept represents the amount of the total bill.
SC 4. You are planning a ten-day trip to Brazil. You will be spending $2000 for your flight and $100/night for accommodations. The following graph compares the number of days spent versus the total cost of the trip.
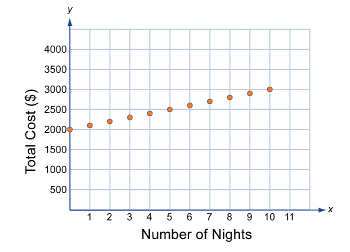
a. State the domain and range of the graph.
b. Indicate how the domain and range are restricted.
 Try This 5
Complete the following questions from your textbook in your course folder ( binder).
Foundations and Pre-calculus Mathematics 10 (Pearson)
TT 5. Complete “Exercises” questions 4, 9, and 16 on pages 319 to 322.
Use the link below to check your answers to Try This 5.
Possible TT5 (Try This 5) Solutions
Mathematics 10C Learn EveryWare © 2010 Alberta Education