Lesson 3: Slope Intercept Form
Module 5: Linear Functions
Connect
![]() Lesson Assessment
Lesson Assessment
Complete the lesson quiz posted under the Quizzes link to the left in moodle or under the Assess tab and ensure your work in your binder (course folder) is complete.
 Project Connection ** NOT ASSIGNED**
iStockphoto/ Thinkstock
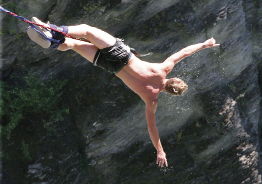
Bungee jumping is an activity where a person jumps from a bridge, a crane, or some other elevated point attached by only a bungee cord. While bungee jumping is not an Olympic sport, there are bungee jumping competitions that award points in the same manner as platform diving.
In this Project Connection and the Project Connection in Lesson 4, you will carry out a procedure that can be modelled by a linear function. You will determine the equation of the line based on experimental data. You will then use that data to make predictions.
Go to the Unit 3 Project and complete Math Lab: Bungee Jump Simulation.
 Going Beyond
© Gina Sanders/5170620/Fotolia
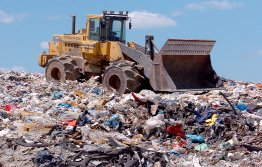
Unfortunately, the amount of garbage on Earth is growing. It’s likely that you and your family are aware of the importance of recycling; everyone needs to play a role in reducing waste.
The planet has a limited number of resources and limited space for garbage. Think about these limitations as you would think about restrictions on the domain and the range of a graph.
1. Conduct an Internet search and find information about a landfill near you.
a. What is the size of the landfill?
b. How much garbage is received at the landfill each day?
c. When will that landfill reach capacity?
2. Graph your data.
3. Calculate the slope and y-intercept.
4. If the rate remains constant, how long will it be until the landfill is completely full?
5. What if the slope of your graph doubles?
6. What if the slope could be reduced by half? How does the changing slope affect the domain and range on your graph?
7. What do all of these values mean in your specific situation?