Lesson 1
1. Lesson 1
1.2. Are You Ready?
Module 3: Quadratics
Are You Ready?
-
- Complete the following data table for the relation y = 2x + 4.
x
0
1
2
3
−1
−2
0.5
y
Answer
- Draw a graph from the table of values from part a. Join the data points in a smooth curve. If you do not have graph paper of your own, you can use 1-cm Grid Paper. Answer
- Complete the following data table for the relation y = 2x + 4.
- This chart shows how much water vapour (in grams) a kilogram of air can hold at different temperatures.
Temperature
(°C)
Water Vapour
(g/kg of air)
−40
0.1
−35
0.2
−30
0.3
−25
0.51
−20
0.75
−10
1.8
0
3.8
5
5
10
7.8
15
10
20
15
25
20
30
27.7
35
35
40
49.8
- For each set of graphs, state which graph is a function and which graph is not a function. Explain how you know.
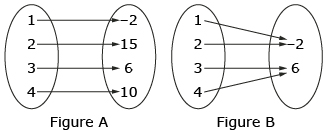
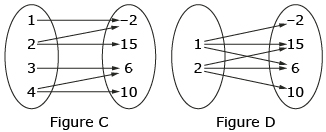
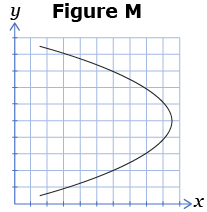
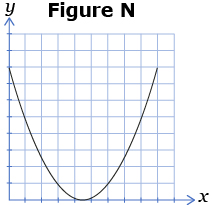
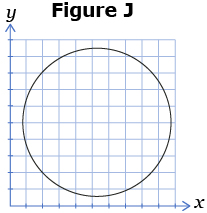
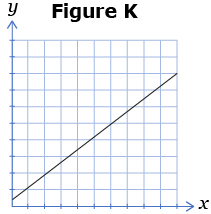
- For each of the following figures, tell which figures are functions and which are not. Give a reason for your answer.
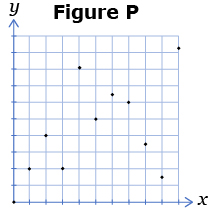
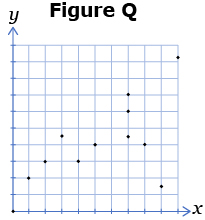
- For each of the following ordered pairs, tell which sets are functions and which are not. Give a reason for your answer.


Answer
If you successfully completed the Are You Ready? questions, move on to the Discover section of the lesson.
If you experienced difficulties with the questions, use the resources in the Refresher section to review the concepts before continuing through the lesson.