Lesson 2
1. Lesson 2
1.2. Are You Ready?
Module 3: Quadratics
Are You Ready?
- In Lesson 1 you looked at how changing the values of a, b, and c affect the graph of a function written in standard form (y = ax2 + bx + c). Use the interactive Do You Know Your ABCs? to ensure you know your ABCs of the quadratic function written in standard form.
On the right side of the applet, you will see sliders that can be used to change the values of a, b, and c. Before moving the sliders, consider the following:
- Each graph has the same shape, so what does that tell you about the value of a?

- Each graph has a different y-intercept. What does that tell you about the values of c for the graphs?
- You may find it helpful to choose one of the coloured graphs to determine the values of a and b first.
Values that Hide the Dashed Curve
Curve Colour
Light Blue
Blue
Purple
Red
Orange
Green
Dark Green
Dark Blue
Dark Purple
a-value
b-value
c-value
- Each graph has the same shape, so what does that tell you about the value of a?
Complete the following Are You Ready? questions to be sure you have mastered the prerequisite skill of identifying the coordinates of any point on a grid.
- Use the following graph to answer questions 2.a. to 2.c.
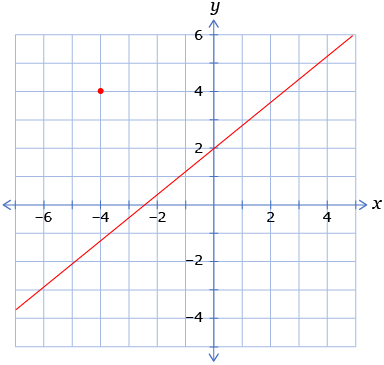
- What are the coordinates of the red dot in the graph?
- What are the coordinates of the point where the graph crosses the x-axis? (This point is called the x-intercept.)
- What are the coordinates of the point where the graph crosses the y-axis? (This point is called the y-intercept.)
- What are the coordinates of the red dot in the graph?
-
Use the following graph to answer questions 3.a. to 3.c.
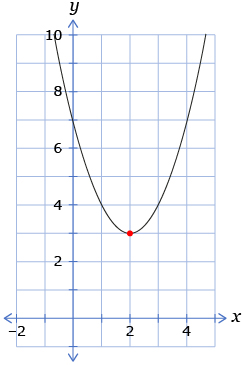
- What are the coordinates of the red dot in the graph of the parabolic function?
- What are the coordinates of the point where the parabolic graph crosses the x-axis? (This point is called the x-intercept.)
- What are the coordinates of the point where the parabolic graph crosses the y-axis? (This point is called the y-intercept.)
- What are the coordinates of the red dot in the graph of the parabolic function?
- Use the following graph to answer questions 4.a. to 4.c.
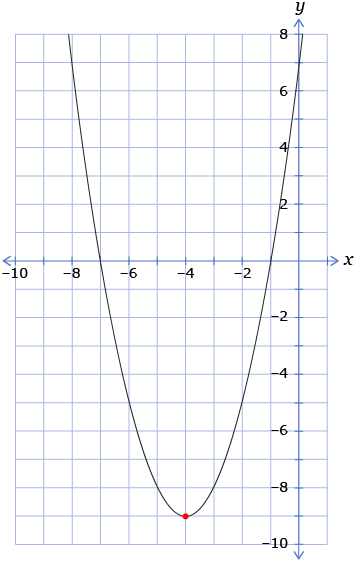
- What are the coordinates of the red dot in the graph of the parabolic function?
- What are the coordinates of the point where the parabolic graph crosses the x-axis? (This point is called the x-intercept.)
- What are the coordinates of the point where the parabolic graph crosses the y-axis? (This point is called the y-intercept.)
- What are the coordinates of the red dot in the graph of the parabolic function?
If you successfully completed the Are You Ready? questions, move on to the Discover section of the lesson.
If you experienced difficulties with the Are You Ready? questions, use the resources in the Refresher section to review the concepts before continuing through the lesson.