Lesson 2
1. Lesson 2
1.9. Explore 5
Module 3: Quadratics
For this module on quadratics, it is important to know the following:
- The domain of a quadratic function is always a member of the real numbers.
- The range is always greater than or equal to the minimum value if the parabola opens upwards.
- The range is less than or equal to the maximum value if the parabola opens downwards.
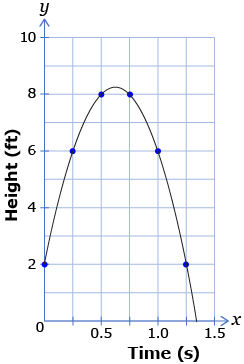
When determining domain and range, or any characteristics of the graph of a quadratic function, it is important to think about what situation is being modelled by the data. For instance, in Self-Check 2, you looked at a graph of the height of a volleyball versus time. In this situation, a negative height is not possible—it would mean that the volleyball went through the floor! If you were to give the range for this graph, it could not be less than zero.
|
Time (s) |
Height (ft) |
|
0.00 |
2 |
|
0.25 |
6 |
|
0.50 |
8 |
|
0.75 |
8 |
|
1.00 |
6 |
|
1.25 |
2 |
Adapted from: CANAVAN-MCGRATH ET AL. Principles of Mathematics 11, © 2012 Nelson Education Limited. p. 325. Reproduced by permission.
It is important to always keep the context of the problem in mind. This helps you to ensure that the values you determine for the characteristics of the graph make sense or are reasonable for the given situation.
Read “Example 2: Reasoning about the maximum value of a quadratic function” on pages 327 and 328 of the textbook. In this example, the function models the path of water at a children’s splash park. How does Manuel use his understanding of the characteristics of quadratic functions to solve the problem?
![]()
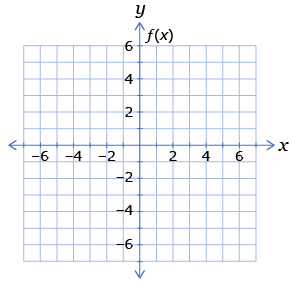
Although the standard form of the quadratic function has been written as y = ax2 + bx + c, it can also be written as f(x) = ax2 + bx + c. The left side is then read as “the function of x.” The f(x) replaces the y in the equation. If this form is used, the vertical axis on the graph would need to be labelled as f(x) like the following graph.
Letters that have specific meanings, other than x and y, can be used to write quadratic functions. In physics, t is used to represent time and v is used for velocity. A quadratic function used in physics where the f(t) represents the distance travelled by an accelerating object is  . The letters chosen for variables often represent specific quantities, such as d for distance and m for mass. You can use any letter: you just have to say what it represents. Sometimes even Greek letters are used, such as theta (
![]() ), mu (μ), and phi (
), mu (μ), and phi ( ).
).
Try This 3
Go to the interactive applet Graphs of Quadratic Functions to use the characteristics of graphs of quadratic functions to solve problems.

Once you log in, you need to choose “Graphs of Quadratic Functions” from the list. There are five sections to the applet—click on each icon at the top of the page and then work through each section.
You may want to take a screenshot of the “Summing Up” pages and place these in your notes organizer.