Lesson 2
1. Lesson 2
1.6. Explore 2
Module 5: Trigonometry Applications and Identities
In Try This 2 you will explore the model of a system that includes numbers.
Try This 2
A tide chart predicts the height of water at a specific location at particular times. Consider the following tide chart for Vancouver from October 7 to 11, 2011.
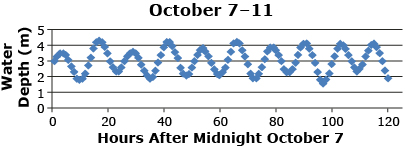
SOURCE: Tide, Currents, and Water Levels, (Fisheries and Oceans Canada, 2011), <http://www.tides.gc.ca/>; (09/02/2012).
- What general shape is the graph? Is a sine or cosine model reasonable?
- Try to model the graph using the equation
 Use the following table to help you.
Graph Dimension What does the dimension represent in the problem? Value of Parameter amplitude ≈ a ≈ period ≈ b ≈ phase shift ≈ c ≈ midline ≈ d ≈
Write your equation in the form

- Use Tides Exploration 1 to determine an equation that matches the data. Adjust the parameters a, b, c, and d until the graph overlaps the points as closely as possible. Write down your equation.
-
How does the equation you determined in question 2 compare to the equation you determined in question 3?
- Three points on the original scatter plot are (10, 1.9), (50, 3.0), and (100, 3.3). Calculate the y-value at the times of 10, 50, and 100 hours by using each of your equations. Use a chart similar to the following one to organize the calculations. How close are your predicted heights to the actual heights?
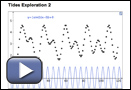
x-Value y-Value Using Equation Found in Question 2 y-Value Using Equation Found in Question 3 Actual y-Value 10 1.9 50 3.0 100 3.3 - Consider the tide table for the same location from November 16 to 20, 2011. What characteristics of this graph are similar to a sine graph? What is different?
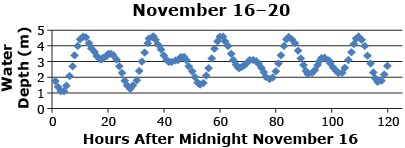
SOURCE: Tide, Currents, and Water Levels, (Fisheries and Oceans Canada, 2011), <http://www.tides.gc.ca/>; (09/02/2012). - Is it reasonable to use an equation of the form
 to model this data?
 -
Use Tides Exploration 2 in an attempt to model the data using an equation of the form
-
Does it make sense to use an equation of the form
 to model this data?
![]() Save your answers in your course folder.
Save your answers in your course folder.
Share 2
With a partner or group, discuss the following questions based on what you learned in Try This 2.
- How can you decide when
 should be used to model data?
 - What advantage is there in using an equation to represent data?
- What are some problems with using one of the equations from questions 2 and 3 of Try This 2 to predict the tide height at 5000 h?