Lesson Two - Social Inequality in Canada
2.2 Social Inequality and Mobility in Canada
Most sociologists define social class as a grouping based on similar social factors like wealth, income, education, and occupation. As we note later in the chapter, there is dispute within the discipline about the relative importance of different criteria for characterizing economic position. Whether the Marxist emphasis on property ownership is more important than the Weberian emphasis on gradations of occupational status is a matter for debate. Each definition captures some aspects of the experience of inequality in modern society but misses others. Either way, the concept of class does imply a shared standard of living based on social factors like wealth, income, education, and occupation. These factors also affect how much power and prestige a person has. In most cases, having more money means having more power or more opportunities.
Standard of Living
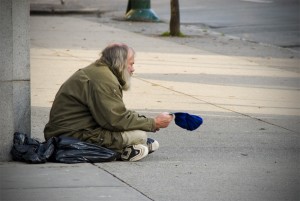
(Image courtesy of Wayne Stadler/Flickr).
“When you’ve set up a place to sleep for the night, someone comes along and threatens you or forces you to leave, it’s no way to live. It’s tiring, to be forced to move every day or every night when you’re cold and wet and have no place to go.” (Testimony of Drug War Survivors member Harvey Clause, as quoted in Hollett, 2015)
In the last century, Canada has seen a steady rise in standard of living, the level of wealth available to acquire the material necessities and comforts to maintain one’s lifestyle. The standard of living is based on factors such as income, employment, class, poverty rates, and affordability of housing. Because standard of living is closely related to quality of life, it can represent factors such as the ability to afford a home, own a car, and take vacations. Access to a standard of living that enables people to participate on an equal basis in community life is not equally distributed, however. The irony of rising standards of living is that one does not have to live in absolute poverty — “a severe deprivation of basic human needs, including food, safe drinking water, sanitation facilities, health, shelter, education and information” (United Nations, 1995) — to be marginalized and socially excluded. Relative poverty refers to the minimum amount of income or resources needed to be able to participate in the “ordinary living patterns, customs, and activities” of a society (Townsend, 1979).
In Canada, a small portion of the population has the means to the highest standard of living. Statistics Canada data from 2005 showed that 10 percent of the population held 58 percent of our nation’s wealth (Osberg, 2008). In 2007, the richest 1 percent took 13.8 percent of the total income earned by Canadians (Yalnizyan, 2010). In 2010, the median income earner in the top 1 percent earned 10 times more than the median income earner of the other 99 percent (Statistics Canada, 2013). Wealthy people receive the most schooling, have better health, and consume the most goods and services. Wealthy people also wield decision-making power. One aspect of their decision-making power comes from their positions as owners or top executives of corporations and banks. They are able to grant themselves salary raises and bonuses. By 2010, only two years into the economic crisis of 2008, the executive pay of CEOs at Canada’s top 100 corporations jumped by 13 percent (McFarland, 2011), while negotiated wage increases in 2010 amounted to only 1.8 percent (HRSDC, 2010).
Many people think of Canada as a middle-class society. They think a few people are rich, a few are poor, and most are pretty well off, existing in the middle of the social strata. But as the data above indicate, the distribution of wealth is not even. Millions of women and men struggle to pay rent, buy food, and find work that pays a living wage. Moreover, the share of the total income claimed by those in the middle-income ranges has been shrinking since the early 1980s, while the share taken by the wealthiest has been growing (Osberg, 2008).
Trends in Social Inequality
The news from sociological research into inequality is that the gap in income and wealth between the rich and the poor has been increasing in Canada (Osberg, 2008). In 1982, the median income earner in the top 1% of incomes earned seven times more than the median income earner in the other 99%. In 2010, the median income earner in the top 1% earned ten times more. Moreover, while the median income for the top 1% increased from $191,600 to $283,000 in constant dollars (i.e., adjusted for inflation), the median income for the bottom 99% only increased from $28,000 to $28,400. In the early 1980s, the top 1% of income earners accounted for 7% of the total income generated in Canada, whereas in 2010 they accounted for 10.6%, down slightly from 12.1% in 2006 (Statistics Canada, 2013). In effect, the incomes for middle-income earners remained flat over the last 30 years, while the incomes for the top 1% increased significantly both in absolute terms and as a proportion of all incomes. (Note: Median income is not the same as average income. It refers to the amount that the person who is exactly in the middle of an income range earned: 50% of the people in this income range earned more than the median, and 50% earned less).
| Income Group | 1951 | 1961 | 1971 | 1981 | 1991 | 1996 | 2001 | 2005 |
|---|---|---|---|---|---|---|---|---|
| Bottom 20% (poorest) | 4.4% | 4.2% | 3.6% | 4.6% | 4.5% | 4.2% | 4.1% | 4.1% |
| Second 20% | 11.2% | 11.9% | 10.6% | 11% | 10% | 9.6% | 9.7% | 9.6% |
| Middle 20% | 18.3% | 18.3% | 17.6% | 17.7% | 16.4% | 16% | 15.6% | 15.6% |
| Fourth 20% | 23.3% | 24.5% | 24.9% | 25.1% | 24.7% | 24.6% | 23.7% | 23.9% |
| Top 20% (richest) | 42.8% | 41.1% | 43.3% | 41.6% | 44.4% | 45.6% | 46.9% | 46.9% |
Sources Statistics Canada (1998) Income Distribution by Size in Canada Catalogue No. 13-207, CANSIM Table 202-0701, V1546465, J.R. Podoluk (1968) Incomes of Canadians, Dominion Bureau of Statistics.
This discrepancy does not simply mean that the very rich are increasing their share of the wealth at the expense of the very poor — the middle classes are also losing their share of the wealth. One way to analyze this trend is to examine the changing distribution of income in Canada over time. In Table 9.2 (above), changes in inequality are measured by looking at how the total annual income is distributed between each fifth (or “quintile”) of Canadian families from the lowest earning to highest earning for different years (Osberg, 2008). If perfect equality of income existed, each quintile would have earned exactly 20% of the total income. Instead, Table 9.2 shows that between 1951 and 1981 the top 20% of family units received around 42% of total income, but after 1981 this figure steadily increased to 47%. On the other hand, the share of income of the middle 60% of families declined by 4.7%, going from 53.8% to 49.1%. The lowest 20% also lost 0.5% of their already tiny share, going from 4.6% to 4.1%. Although the majority of people in Canada have not seen any growth in real income in three decades (Osberg, 2008), the average income of the top 1% grew by about 180% (Yalnizyan, 2010). Over this period, the share of the total income received by the top 1% has doubled, the top 0.1% has tripled, and the top 0.01% has quintupled (Yalnizyan, 2010).
Why is this news? For several decades, Lars Osberg notes that the joke was that the study of income inequality was like watching grass grow because nothing ever happened (2008). Between 1946 and 1981, changes in income inequality were small despite the fact the Canadian economy went through a massive transformation: It transformed from an agricultural base to an industrial base; the population urbanized and doubled in size; the overall production of wealth measured by gross domestic product (GDP ) increased by 4.5%; and per capita output increased by 227% (Osberg, 2008). As Osberg puts it, the key question was why did economic inequality not change during this period of massive transformation? From 1981 until the present, during another period of rapid and extensive economic change in which the overall production of wealth continued to expand, economic inequality has increased dramatically. What happened?
The main explanatory factor is that between 1946 and 1981 real wages increased in pace with the growth of the economy, but since 1981 only the top 20% of families have seen any meaningful increase in real income while the very wealthy have seen huge increases. The taxable income of the top 1% of families increased by 80% between 1982 and 2004 (Obsberg, 2008). Neoliberal policies of reduced state expenditures and tax cuts have been major factors in defining the difference between these two eras. The neoliberal theory that the benefits of tax cuts to the rich would “trickle down” to the middle class and the poor has proven false. The biggest losers with regard to neoliberal policy, of course, are the very poor. As Osberg notes, it was not until the 1980s and 1990s that the homeless — those forced to beg in the streets and those dependent on food banks — began to appear in Canada in significant numbers (2008).
Some have argued that to the degree that equality of opportunity exists, inequality of condition or inequality of “outcome” is perhaps not fair, but it is justifiable. Others have argued that because capitalism is built on the basis of structural inequality, equality of condition is impossible. The idea that equality of opportunity — a meritocracy — actually exists and that it leads to a meaningful access to social mobility — the movement of people from one social position to another — is debatable, as we will see below. Also, it is important to note that if total equality of condition — a world where everyone’s social position and financial rewards would be exactly the same — is unlikely, varying degrees of social inequality are possible. In fact degrees of social inequality vary significantly between jurisdictions.
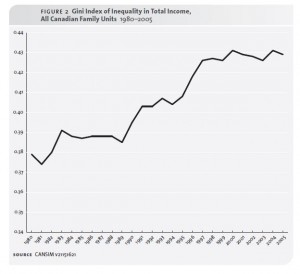
Gini Index of inequality: 1980-2005 (Figure courtesy of Osberg, 2008/CCPA)
The Gini Index is a measure of income inequality in which zero is absolute equality and one is absolute inequality. Table 9.3 shows that Canada’s degree of inequality increased by 5% between 1980 and 2005 from a Gini Index of 0.38 to 0.43 (Osberg, 2008). From a comparative perspective, Canada’s Gini Index is much higher than many European countries but is lower than the extremes of inequality in the United States and Mexico (who are Canada’s NAFTA partners). See Table 9.4 (below). This comparison indicates that a much greater equality of condition can exist even under the same pressures of globalization if different social and economic policy models are chosen. Even though the countries with the lowest levels of inequality — Denmark, Sweden, the Netherlands, and Austria — have progressive tax systems and strong welfare states, they are able to maintain high levels of employment and economic growth while remaining “competitive” in the global economy (Osberg, 2010). If addressing poverty and inequality rather than promoting greater transfers of wealth to the rich is a reasonable goal, a variety of viable policy alternatives are available from which Canadians can choose.

Social Classes in Canada
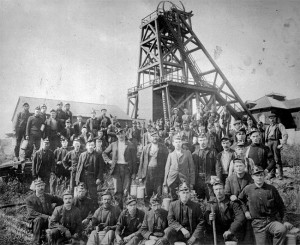
The traditional working class — Miners in Nanaimo, B.C. (late 19th century). The Nanaimo coal mines were the site of a brutal two-year strike from 1912–1914 against low wages and dangerous working conditions. Source: Miners of Number One Mine, Nanaimo, at the pithead, B-03624 (Image courtesy of the Royal B.C. Museum) |
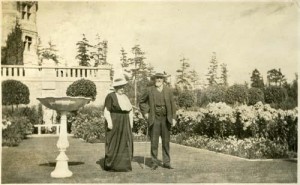
The owning class—James and Laura Dunsmuir shown beside their Italian-style garden at their Hatley Castle residence near Victoria, B.C. (now part of Royal Roads University). James Dunsmuir was heir to his family’s coal fortune and managed the family coal operations on Vancouver Island from 1876–1910. He was a powerful spokesman for capitalist interests and anti-union efforts in B.C. and spent two years as B.C. Premier from 1900–1902. (Image courtesy of …) |
Does a person’s appearance indicate class? Can you tell a person’s education level based on clothing? Do you know a person’s income by the car one drives? There was a time in Canada when people’s class was more visibly apparent. In some countries, like the United Kingdom, class differences can still be gauged by differences in schooling, lifestyle, and even accent. In Canada, however, it is harder to determine class from outward appearances.
For sociologists, too, categorizing class is a fluid science. The chief division in the discipline is between Marxist and Weberian approaches to social class (Abercrombie & Urry, 1983). Marx’s analysis, as we saw earlier in this chapter, emphasized a materialist approach to the underlying structures of the capitalist economy. Marx’s definition of social class rested essentially on one variable: a group’s relation to the means of production (ownership or non-ownership of productive property or capital). In Marxist class analysis there are, therefore, two dominant classes in capitalism — the working class and the owning class — and any divisions within the classes based on occupation, status, education, etc. are less important than the tendency toward the increasing separation and polarization of these classes.
Weber defined social class slightly differently, as the “life chances” or opportunities to acquire rewards one shares in common with others by virtue of one’s possession of property, goods, or opportunities for income (1969). Owning property/capital or not owning property/capital is still the basic variable that defines a person’s class situation or life chances. However, class is defined with respect to markets rather than the process of production. It is the value of one’s products or skills on the labour market that determines whether one has greater or lesser life chances. This leads to a hierarchical class schema with many gradations. A surgeon who works in a hospital is a member of the working class in Marx’s model, just like cable TV technicians, for example, because he or she works for a wage or salary. Nevertheless the skill the surgeon sells is valued much more highly in the labour market than that of cable TV technicians because of the relative rarity of the skill, the number of years of education required to learn the skill, and the responsibilities involved in practising the skill.
Analyses of class inspired by Weber tend to emphasize gradations of status with regard to a number of variables like wealth, income, education, and occupation. Class stratification is not just determined by a group’s economic position but by the prestige of the group’s occupation, education level, consumption, and lifestyle. It is a matter of status — the level of honour or prestige one holds in the community by virtue of ones social position — as much as a matter of class. Based on the Weberian approach, some sociologists talk about upper, middle, and lower classes (with many subcategories within them) in a way that mixes status categories with class categories. These gradations are often referred to as a group’s socio-economic status (SES), their social position relative to others based on income, education, and occupation. For example, although plumbers might earn more than high school teachers and have greater life chances in a particular economy, the status division between blue-collar work (people who “work with their hands”) and white-collar work (people who “work with their minds”) means that plumbers, for example, are characterized as lower class but teachers as middle class. There is an arbitrariness to the division of classes into upper, middle, and lower.
However, this manner of classification based on status distinctions does capture something about the subjective experience of class and the shared lifestyle and consumption patterns of class that Marx’s categories often do not. An NHL hockey player receiving a salary of $6 million a year is a member of the working class, strictly speaking. He might even go on strike or get locked out according to the dynamic of capital/labour conflict described by Marx. Nevertheless it is difficult to see what the life chances of the hockey player have in common with a landscaper or truck driver, despite the fact they might share a common working-class background.
Social class is, therefore, a complex category to analyze. Social class has both a strictly materialquality relating to a group’s structural position within the economic system, and a social quality relating to the formation of status gradations, common subjective perceptions of class, political divisions in society, and class-based lifestyles and consumption patterns. Taking into account both the Marxist and Weberian models, social class has at least three objective components: a group’s position in the occupational structure, a group’s position in the authority structure (i.e., who has authority over whom), and a group’s position in the property structure (i.e., ownership or non-ownership of capital). It also has an important subjective component that relates to recognitions of status, distinctions of lifestyle, and ultimately how people perceive their place in the class hierarchy.
One way of distinguishing the classes that takes this complexity into account is by focusing on the authority structure. Classes can be divided according to how much relative power and control members of a class have over their lives. On this basis, we might distinguish between the owning class (or bourgeoisie), the middle class, and the traditional working class. The owning class not only have power and control over their own lives, their economic position gives them power and control over others’ lives as well. To the degree that we can talk about a “middle class” composed of small business owners and educated, professional, or administrative labour, it is because they do not generally control other strata of society, but they do exert control over their own work to some degree. In contrast, the traditional working class has little control over their work or lives. Below, we will explore the major divisions of Canadian social class and their key subcategories.
The Owning Class

Figure 9.13. Members of the upper class can afford to live, work, and play in exclusive places designed for luxury and comfort. (Photo courtesy of PrimeImageMedia.com/Flickr)
The owning class is considered Canada’s top, and only the powerful elite get to see the view from there. In Canada, the richest 86 people (or families) account for 0.002 percent of the population, but in 2012 they had accumulated the equivalent wealth of the lowest 34 percent of the country’s population (McDonald, 2014). The combined net worth of these 86 families added up to $178 billion in 2012, which equalled the net worth of the lowest 11.4 million Canadians. In terms of income, in 2007 the average income of the richest 0.01 percent of Canadians was $3.833 million (Yalnizyan, 2010).
Money provides not just access to material goods, but also access to power. Canada’s owning class wields a lot of power. As corporate leaders, their decisions affect the job status of millions of people. As media owners, they shape the collective identity of the nation. They run the major network television stations, radio broadcasts, newspapers, magazines, publishing houses, and sports franchises. As philanthropists, they establish foundations to support social causes they believe in. They also fund think tanks like the C. D. Howe Institute and the Fraser Institute that promote the values and interests of business elites. As campaign contributors, they influence politicians and fund campaigns, usually to protect their own economic interests.
Canadian society has historically distinguished between “old money” (inherited wealth passed from one generation to the next) and “new money” (wealth you have earned and built yourself). While both types may have equal net worth, they have traditionally held different social standing. People of old money, firmly situated in the upper class for generations, have held high prestige. Their families have socialized them to know the customs, norms, and expectations that come with wealth. Often, the very wealthy do not work for wages. Some study business or become lawyers in order to manage the family fortune.
New money members of the owning class are not oriented to the customs and mores of the elite. They have not gone to the most exclusive schools. They have not established old-money social ties. People with new money might flaunt their wealth, buying sports cars and mansions, but they might still exhibit behaviours attributed to the middle and lower classes. For example, Toronto politicians Rob and Doug Ford are estimated to hold family assets worth $50 million, yet they present themselves as just “average guys” who stand with their blue-collar constituents against “rich elitist people” (McArther, 2013; Warner, 2014). Rob Ford’s infamous crack cocaine smoking, public binge drinking, and use of foul language would not make him at home within the circles of old money in Canada.
The Middle Class

Figure 9.14. These members of a club likely consider themselves middle class. (Photo courtesy of United Way Canada-Centraide Canada/Flickr)
Many people call themselves middle class, but there are differing ideas about what that means. People with annual incomes of $150,000 call themselves middle class, as do people who annually earn $30,000. That helps explain why some sociologists divide the middle class into upper and lower subcategories. These divisions are based on gradations of status defined by levels of education, types of work, cultural capital, and the lifestyles afforded by income.
Upper-middle-class people tend to hold bachelor’s and postgraduate degrees in subjects such as business, management, law, or medicine that lead to occupations in the professions. Professions are occupations that claim high levels of specialized technical and intellectual expertise and are governed and regulated by autonomous professional organizations (like the Canadian Medical Association or legal bar associations). Lower-middle-class members hold bachelor’s degrees or associate’s degrees from two-year community or technical colleges that lead to various types of white collar, service, administrative, or paraprofessional occupations.
Comfort is a key concept to the middle class. Middle-class people work hard and live fairly comfortable lives. Upper-middle-class people tend to pursue careers that earn comfortable incomes. They provide their families with large homes and nice cars. They may go skiing or boating on vacation. Their children receive quality educations (Gilbert, 2010).
In the lower middle class, people hold jobs supervised by members of the upper middle class. They fill technical, lower-level management or administrative support positions. Compared to traditional working-class work, lower-middle-class jobs carry more prestige and come with slightly higher paycheques. With these incomes, people can afford a decent, mainstream lifestyle, but they struggle to maintain it. They generally do not have enough income to build significant savings. In addition, their grip on class status is more precarious than in the upper tiers of the class system. When budgets are tight, lower-middle-class people are often the ones to lose their jobs.
The Traditional Working Class

Figure 9.15. This man is a custodian at a restaurant. His job, which is crucial to the business, is considered lower class. (Photo courtesy of Frederick Md Publicity/Flickr)
The traditional working class is sometimes also referred to as being part of the lower class. Just like the middle and upper classes, the lower class can be divided into subsets: the working class, the working poor, and the underclass. Compared to the middle class, traditional working-class people have less of an educational background and usually earn smaller incomes. While there are many working-class trades that require skill and pay middle-class wages, the majority often work jobs that require little prior skill or experience, doing routine tasks under close supervision.
Traditional working-class people, the highest subcategory of the lower class, are usually equated with blue-collar types of jobs: “wage-workers who are engaged in the production of commodities, the extraction of natural resources, the production of food, the operation of the transportation network required for production and distribution, the construction industry, and the maintenance of energy and communication networks” (Veltmeyer, 1986, p. 83). The work is considered blue collar because it is hands-on and often physically demanding. The term “blue collar” comes from the traditional blue coveralls worn by manual labourers.
Beneath those in the working class are the working poor. Like some sections of the working class, they have unskilled, low-paying employment. However, their jobs rarely offer benefits such as retirement planning, and their positions are often seasonal or temporary. They work as migrant farm workers, house cleaners, and day labourers. Some are high school dropouts. Some are illiterate, unable to read job ads. Many do not vote because they do not believe that any politician will help change their situation (Beeghley, 2008).
How can people work full time and still be poor? Even working full time, more than a million of the working poor earn incomes too meagre to support a family. In 2012, 1.8 million working people (including 540,000 working full time year round) earned less than Statistic Canada’s low income cut-off level, which defines poverty in Canada (Johnstone & Cooper, 2013). Minimum wage varies from province to province, from $9.95/h in Alberta to $11/h in Nunavut and Ontario (Retail Council of Canada, 2014). However, it is estimated that a living wage — based on a 35-hour work week — is $19.14/h in Vancouver, $16.60/h in Toronto, and $14.95/h in Hamilton (differences due to the difference in cost of living in these locations). A living wage is the amount needed to meet a family’s basic needs and enable them to participate in community life (Johnstone & Cooper, 2013). Even for a single person, minimum wage is low. A married couple with children will have a hard time covering expenses.
The underclass or lumpenproletariat is Canada’s lowest tier. Members of the underclass live mainly in inner cities. Many are unemployed or underemployed. Those who do hold jobs typically perform menial tasks for little pay. Some of the underclass are homeless. For many, welfare systems provide a much-needed support through food assistance, medical care, housing, and the like.
Social Mobility
Social mobility refers to the ability to change positions within a social stratification system. When people improve or diminish their economic status in a way that affects social class, they experience social mobility. This is a key concept in determining whether inequalities of condition limit people’s life chances or whether we can meaningfully speak of the existence of equality of opportunity in a society. A high degree of social mobility, upwards or downwards, would suggest that the stratification system of a society is in fact open (i.e., that there is equality of opportunity).
Upward mobility refers to an increase — or upward shift — in social class. In Canada, people applaud the rags-to-riches achievements of celebrities like Guy Laliberté who went from street busking in Quebec to being the CEO of Cirque du Soleil, with a net worth of $2.5 billion. Actor and comedian Jim Carey lived with his family in camper van at one point growing up in Scarborough, Ontario. Ron Joyce was a beat policemen in Hamilton before he co-founded Tim Hortons. CEO of Magna International Frank Stronach immigrated to Canada from Austria in 1955 with only $50 to his name. There are many stories of people from modest beginnings rising to fame and fortune. But the truth is that relative to the overall population, the number of people who launch from poverty to wealth is very small. Still, upward mobility is not only about becoming rich and famous. In Canada, people who earn a university degree, get a job promotion, or marry someone with a good income may move up socially.
Downward mobility indicates a lowering of one’s social class. Some people move downward because of business setbacks, unemployment, or illness. Dropping out of school, losing a job, or becoming divorced may result in a loss of income or status and, therefore, downward social mobility.
Intergenerational mobility explains a difference in social class between different generations of a family. For example, an upper-class executive may have parents who belonged to the middle class. In turn, those parents may have been raised in the lower class. Patterns of intergenerational mobility can reflect long-term societal changes.
Intragenerational mobility describes a difference in social class between different members of the same generation. For example, the wealth and prestige experienced by one person may be quite different from that of his or her siblings.
Structural mobility happens when societal changes enable a whole group of people to move up or down the social class ladder. Structural mobility is attributable to changes in society as a whole, not individual changes. In the first half of the 20th century industrialization expanded the Canadian economy, which raised the standard of living and led to upward structural mobility. In today’s work economy, the recession and the outsourcing of jobs overseas have contributed to high unemployment rates. Many people have experienced economic setbacks, creating a wave of downward structural mobility.
Many Canadians believe that people move up in class because of individual efforts and move down by their own doing. In the ideal of equality of opportunity, one’s access to rewards would exactly equal one’s personal efforts and merits toward achieving those rewards. One’s class position or other social characteristics (gender, race, ethnicity, etc.) would not skew the relationship between merit and rewards. Others believe that equality of opportunity is a myth designed to keep people motivated to work hard, while getting them to accept social inequality as the legitimate outcome of personal achievement. The ideology of equality of opportunity is just a mirage that masks real and permanent structural inequality in society. The rich stay rich, and the poor stay poor. Data that measures social mobility suggest that the truth is a bit of both.
Typically social mobility is measured by comparing either the occupational status or the earnings between parents and children. If children’s earnings or status remain the same as their parents then there is no social mobility. If children’s earnings or status moves up or down with respect to their parents, then there is social mobility. Corak and colleagues compared “intergenerational earnings elasticity” between fathers and sons in Canada and the United States (2010). (Some data are available on daughters as well, but it is less common and therefore difficult to use to make cross-national comparisons.) Intergenerational earnings elasticity gives a percentage figure that indicates the degree to which fathers’ income predicts sons’ income (i.e., the degree of intergenerational “stickiness” or lack of social mobility). The data show that there is a much lower degree of social mobility in the United States than in Canada. While earnings elasticity (from 2006 data) in the United States was 0.47, meaning that almost one half of the fathers’ earning advantage was passed on to their sons, in Canada the figure was 0.19, meaning that less than one-fifth of the father’s earnings advantage was passed on. This suggests that Canada has a relatively high rate of social mobility and equality of opportunity compared to the United States, where almost 50 percent of sons remain at the same income level as their fathers. In an international comparison, the United Kingdom had even lower social mobility than the United States with an earnings elasticity of 0.50, while Finland, Norway, and Denmark had greater social mobility than Canada with earnings elasticities of 0.18, 0.17, and 0.15 respectively.
One of the key factors that distinguishes Canada’s degree of social mobility from that of the United States is that the United States has a much greater degree of social inequality to begin with. The higher degree of social inequality is linked to lower degrees of social mobility. The main factor that contributes to the difference in the intergenerational earnings elasticity figures is that there is a great degree of intergenerational social immobility at the lower and higher ranges of the income scale in the United States. For example, over 25 percent of sons born to fathers in the top 10 percent of income earners remain in the top 10 percent, compared to about 18 percent in Canada. On the other hand, in the United States, 22 percent of sons born to fathers in the bottom 10 percent of income earners remain in the bottom 10 percent, while another 18 percent only move up to the bottom 10 to 20 percent of income earners. The figures for Canada are 16 percent and 14 percent respectively (Corak et al., 2010).
However, these data also show that Canada by no means has “perfect” social mobility or equality of opportunity. Class background significantly affects one’s chances to get ahead. For example, the chance that a son born to a father in the 30 to 40 percent or 40 to 50 percent ranges of income earners (i.e., in 2004 families averaging $42,000 or $55,000 a year respectively) would move up into the top 50 percent of income earners (i.e., families averaging $65,000 a year or more) was about 50 percent (Yalnizyan, 2007). In contrast, a son from the bottom 20 percent of income earners had only a 38 percent chance of moving into the top 50 percent of income earners. For the bottom 20 percent of families, 62 percent of sons remained within the bottom 50 percent of income earners (Corak et al., 2010).
Class Traits

Does taste or fashion sense indicate class? Is there any way to tell if this young man comes from an upper-, middle-, or lower-class background? (Photo courtesy of Kelly Bailey/Flickr)
Class traits, also called class markers, are the typical behaviours, customs, and norms that define each class. They define a crucial subjective component of class identities. Class traits indicate the level of exposure a person has to a wide range of cultural resources. Class traits also indicate the amount of resources a person has to spend on items like hobbies, vacations, and leisure activities.
People may associate the upper class with enjoyment of costly, refined, or highly cultivated tastes — expensive clothing, luxury cars, high-end fundraisers, and opulent vacations. People may also believe that the middle and lower classes are more likely to enjoy camping, fishing, or hunting, shopping at large retailers, and participating in community activities. It is important to note that while these descriptions may be class traits, they may also simply be stereotypes. Moreover, just as class distinctions have blurred in recent decades, so too have class traits. A very wealthy person may enjoy bowling as much as opera. A factory worker could be a skilled French cook. Pop star Justin Bieber might dress in hoodies, ball caps, and ill fitting clothes, and a low-income hipster might own designer shoes.
These days, individual taste does not necessarily follow class lines. Still, you are not likely to see someone driving a Mercedes living in an inner-city neighbourhood. And most likely, a resident of a wealthy gated community will not be riding a bicycle to work. Class traits often develop based on cultural behaviours that stem from the resources available within each class.