Lesson 3
1. Lesson 3
1.1. Discover
Module 1: Function Transformations
Discover
Try This 1
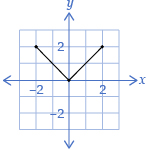
- On a piece of graph paper, plot the following function. You can use Grid Paper Template, available in the Toolkit, if you like.
- Use the original function from question 1 to draw each mapping from the following table. Use a different colour for each mapping or drawing to make your graph(s) easier to read.
Mapping
Image Points
Description of How the Graph Transformed
Diagram of Transformation
(x, y) → (3x, y)
(x, y) → (
 x, y)
x, y)(x, y) → (x, 4y)
(x, y) → (x,
 y)
y)(x, y) → (−2x, y)
(x, y) → (x, −3y)
-
- What effect does multiplying all x-coordinates by a positive constant have on the figure?
- What effect does multiplying all y-coordinates by a positive constant have on the figure?
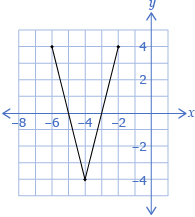
- Repeat questions 1 and 2 by using the following function.
- Revisit question 3. Are your answers still the same?
![]() Save your work in your course folder.
Save your work in your course folder.
Share 1
With a partner or group, discuss the following questions based on the information from Try This 1.
- How does the graph change when the x-coordinate is multiplied by a value
- greater than 1?
- between 0 and 1?
- that is negative?
- How would your answers from question 1 change for a y-coordinate?
![]() If required, save a record of your discussion in your course folder.
If required, save a record of your discussion in your course folder.