Lesson 6
1. Lesson 6
1.11. Connect
Module 4: Quadratic Equations and Inequalities
Open your copy of the Lesson 6 Assignment, which you saved in your course folder at the start of this lesson. Complete the assignment.
![]() Save your work in your course folder.
Save your work in your course folder.
Project Connection

© wong yu liang/29976438/Fotolia
Go to Module 4 Project: Imagineering. Complete Step 4: Marketing.
![]() Save your work in your course folder.
Save your work in your course folder.
Going Beyond
The following graph shows the parabola with equation y = x2. How can you use algebra to determine the values of the slope of a linear function that would intersect a given parabola in one, two, or zero points?
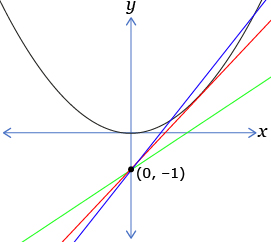
Consider the system of equations represented by the graph.
y = x2
y = mx − 1
Solve this system to determine the values of m that would result in
- two solutions
- one solution
- no solutions
You may have to use what you learned about the discriminant in Lesson 4 in order to complete this exercise. Some aspects of the solution will be covered in the final lesson of this module, so you may wish to return to this problem after completing the module.
![]() Save your work in your course folder.
Save your work in your course folder.