Lesson 7
1. Lesson 7
1.8. Explore 4
Module 4: Quadratic Equations and Inequalities
Writing an Inequality to Describe a Given Graph
You have learned how to graph linear and quadratic inequalities in two variables. You will now learn how to write an inequality to describe a given graph.
Try This 4
-
- For the graph shown, write the equation of the boundary.
- What inequality sign should be used? Write the inequality.
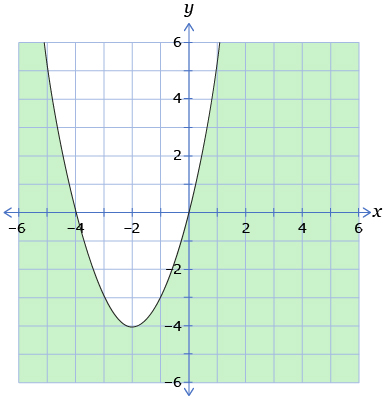
- For the graph shown, write the equation of the boundary.
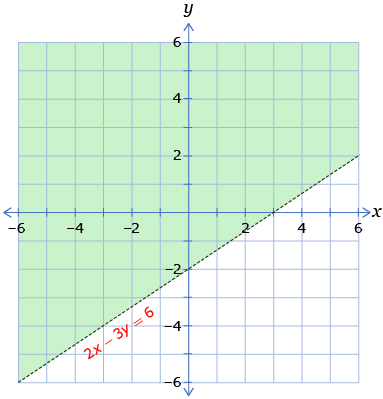
- In the graph shown, the equation of the boundary is given. Replace the equal sign in the equation 2x − 3y = 6 with an inequality symbol such that the resulting inequality describes the graph.
![]() Save your responses in your course folder.
Save your responses in your course folder.
Share 2
With a classmate, compare your strategies for each of the exercises in Try This 4. If both you and your partner used the same strategy, see if you can develop a second strategy together. Discuss the relative benefits and drawbacks of each strategy.