Lesson 7
1. Lesson 7
1.11. Lesson 7 Summary
Module 4: Quadratic Equations and Inequalities
Lesson 7 Summary

© Shu He
In this lesson you investigated the following questions:
- How are the properties of linear and quadratic inequalities in two variables related to their graphs?
- How are linear and quadratic inequalities in two variables applied in design?
You explored linear inequalities and quadratic inequalities in two variables, and you learned how to graph these inequalities. To graph a linear or quadratic inequality, you must answer two key questions:
- How do I graph the boundary?
- How do I know which half-plane should be shaded?
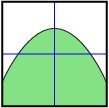
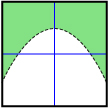
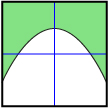
The following table summarizes the properties of the graph of linear and quadratic inequalities given each type of inequality symbol.
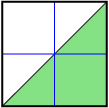
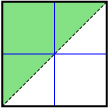
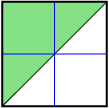
| < | ≤ | > | ≥ | |
| Boundary Type | dashed | solid | dashed | solid |
| Shading Relative to Boundary when y Is Isolated | below | below | above | above |
| Linear Inequality | 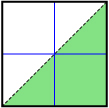 |
 |
 |
 |
| Quadratic Inequality | 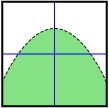 |
 |
 |
 |
You also learned how to use the graphs of linear and quadratic inequalities to model problems involving constraints. These models are used in design and other industries to find possible solutions to problems.
In the final lesson of this module you will investigate solutions to quadratic inequalities in one variable. You will investigate both graphical and algebraic methods as solution strategies.