Lesson 2
1. Lesson 2
1.4. Discover
Module 7: Absolute Value and Reciprocal Functions
Discover

In this Discover section you will engage in guided exploration of the graphs of absolute value functions. Using applets, you will manipulate the parameters of both linear and quadratic functions to observe what happens when you take the absolute value of those graphs.
At the end of this section, see if you can relate your discoveries to the cartoon strip.
Try This 1
Part A: The Absolute Value of a Linear Function
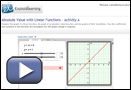
Screenshot reprinted with permission of ExploreLearning
Step 1: Launch the Absolute Value with Linear Functions – Activity A applet. A window will open that shows the graph of a linear function in the right panel. In the left panel, you can manipulate the equation of the graph. Focus only on the top half of the activity, leaving the assessment questions for later.
Step 2: Change the graph to y = 0.5x − 1. Notice that the graph adjusts to the changes in the equation.
Step 3: In the left panel, select “Show ![]() .” The blue graph that appears is the graph of the absolute value of the linear function.
.” The blue graph that appears is the graph of the absolute value of the linear function.
Step 4: In the left panel, select “Show probe.” This function displays a vertical line on the graph and a table comparing the y-coordinates of the functions displayed on the graph.
Click and drag the “probe line” to different x-coordinates across the grid. Compare the y-values of the linear function and absolute value function. When are they identical? When are they different?
Step 5: Leave the “Show y = ax + b” and “Show ![]() ” selections on. Drag the b-slider to see how the graph is affected. Then do the same with the a-slider.
” selections on. Drag the b-slider to see how the graph is affected. Then do the same with the a-slider.
Part B: The Absolute Value of a Quadratic Function
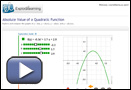
Screenshot reprinted with permission of ExploreLearning
Step 1: Launch the Absolute Value of a Quadratic Function applet. A window will open that shows the graph of a linear function in the right panel. In the left panel, you can manipulate the equation of the graph. Focus only on the top half of the activity, leaving the assessment questions for later.
Step 2: Change the graph to y = 0.7x2 + −5.0x + 2.6. Notice that the graph adjusts to the changes in the equation.
Step 3: In the left panel, select “Show y = |f(x)|.” The black graph that appears is the graph of the absolute value of the quadratic function. Deselect “y = f(x)” to see the graph in its entirety. Then select it again before proceeding to the next step.
Step 4: With both “y = f(x)” and “![]() ” selected, drag the b-slider in the left panel to see how the graph is affected. Then repeat Step 4 with only the "
” selected, drag the b-slider in the left panel to see how the graph is affected. Then repeat Step 4 with only the "![]() ” selected.
” selected.
Step 5: Adjust the a-slider so that a < 0. Repeat Step 4 to see what happens when the a-parameter is negative.
Analysis
Complete the following analysis questions based on your observations from Part A and Part B.
- What is the shape of the absolute value of a linear function?
- What is the shape of the absolute value of a quadratic function?
- In what part of the coordinate plane will you find the graph of an absolute value function? Why?
- How does the graph of the absolute value of a linear or a quadratic function compare with the graph of the corresponding linear or quadratic function?
- How would you instruct someone to graph the absolute value of a linear or quadratic function without the aid of technology?
![]() Save your work in your course folder. You will confirm these results later in the lesson.
Save your work in your course folder. You will confirm these results later in the lesson.