Lesson 2
1. Lesson 2
1.7. Explore 3
Module 7: Absolute Value and Reciprocal Functions
In Try This 2 you learned how to use a table to graph an absolute value function ![]() .
.
You can also use the graph of a function to graph the absolute value of that function. Launch the Graphing Absolute Value Functions: Reflection Method piece to see how.
From the multimedia piece, you learned that you can graph the absolute value of a function by working with the graph of the original function.
In fact, the graph of the absolute value of a function is the same as the graph of the original function, except that any part of the graph that is below the x-axis is reflected across the x-axis.
Turn to part b) of “Example 2” on pages 372–373 in your textbook. This example shows how the absolute value function of the form f(x) = ax2 + bx + c is graphed. As you work through the example, look for the answers to the following questions:
- Was the table method or the reflection method used?
- Why is it necessary to complete the square on the quadratic function?
Self-Check 1
Take a moment to check your understanding of the concepts presented so far. The questions are not for marks, but for you to assess your own learning. Have some scrap paper handy to work through the problems. You may wish to save your rough work in your course folder for future reference. If you make a mistake, don’t worry. You can reset the question, and then try again.
- Complete the table for the functions y = f(x) and
 . Answer
x y = f(x) y = |f(x)|
−3 7 −2 5 0 1 2 −3 5 −9
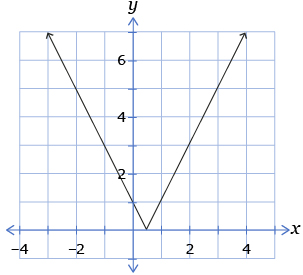
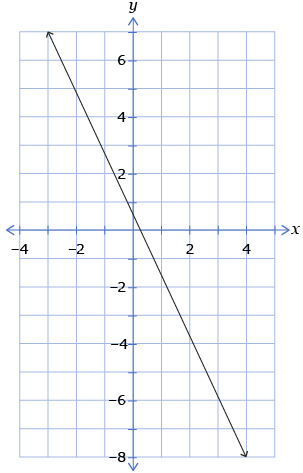
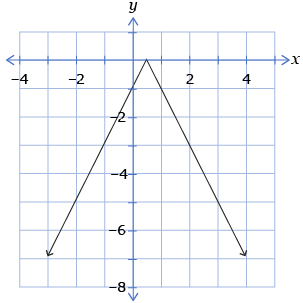
- Which of the following graphs is the graph of
 from question 1?
 B.
B. 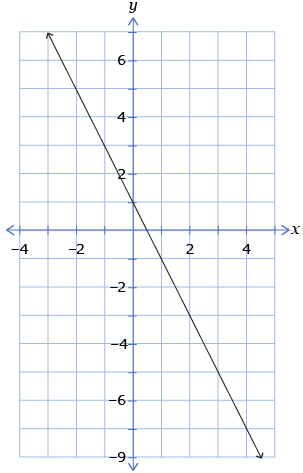
- D.
- The point (−1, −2) is on the graph of y = f(x). Which of the following is the corresponding point on the graph of
 ?
?
- (−1, −2)
- (1, −2)
- (−1, 2)
- (1, 2)
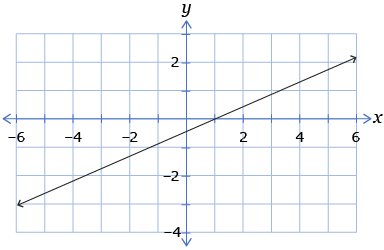
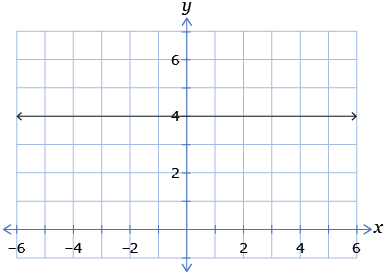
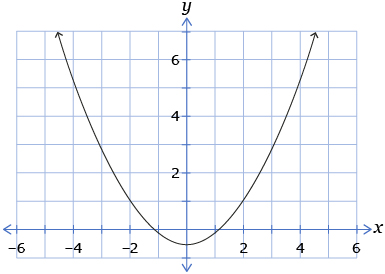
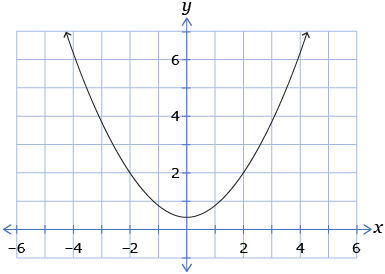
- Which graph(s) below will not change if you graph the absolute value of the corresponding function?