Section 1
1. Section 1
1.36. Discover
Section 1: Simple and Compound Interest
Discover
As you have already seen in Are You Ready?, compound interest can earn more interest than simple interest. In the following activity you will investigate the difference in interest earnings between simple and compound interest. You will visually represent this difference with a graph.
Try This 1
Compare what happens to $1000 over ten years if this money is placed in a simple interest investment, and what occurs if the cash is placed in a compound interest investment. You will use an interest rate of 20% for both investments—this rate is impossible to achieve but helps to emphasize the difference between compound and simple interest.
Fill in the remainder of this table by calculating the interest made and the total amount of money the investment is worth after each year. Remember that the interest will be added into the principal for compound interest but not for simple interest.
Year |
Simple Interest Investment | Compound Interest Investment | ||||
| Beginning Amount ($) | Interest Earned | Total (Accumulated) Amount | Beginning Amount ($) | Interest Earned | Total (Accumulated) Amount |
|
| 1 | $1000 | $200 | $1200 | $1000 | $200 | $1200 |
| 2 | $1200 | $200 | $1400 | $1200 | $240 | $1440 |
| 3 | $1400 | $200 | $1600 | $1440 | $288 | $1728 |
| 4 | $1600 | $200 | $1800 | $1728 | $345.60 | $2073.60 |
| 5 | $1800 | $200 | $2000 | $2073.60 | $414.72 | $2488.32 |
| 6 | $2000 | $200 | $2200 | $2488.32 | $497.66 | $2985.98 |
| 7 | $2200 | $2985.98 | ||||
| 8 | ||||||
| 9 | ||||||
| 10 | ||||||
- Based on the table, in the first year how much did each of the investments earn? Which one earned more?

- By the end of ten years, did the simple interest investment or the compound interest investment earn more interest?
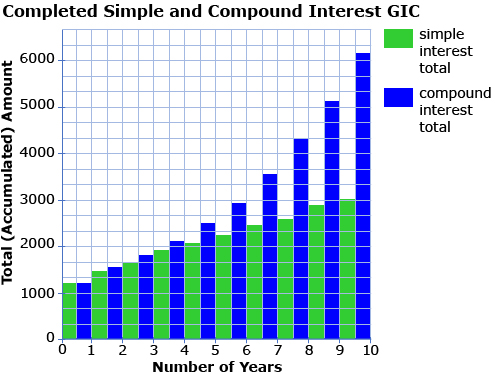
- Using graph paper or a computer program, create a double-bar graph of the total amounts for the simple interest GIC and the compound interest GIC.
- If you connected the tops of the bars for the simple interest investment, would a straight line or a curved line be best?
- If you connected the tops of the bars for the compound interest investment, would a straight line or a curved line be best?
- Use your graph to predict the accumulated total for the simple and compound interest in the eleventh year.
![]() Save a copy of your responses to your course folder.
Save a copy of your responses to your course folder.
Share 1
Share your answers to Try This 1 with a partner or group. After you have shared your answers, discuss the following:
- How does the shape of the bar tops in a simple interest graph differ from a compound interest graph?
- Suggest reasons that could explain this difference in shape.
![]() If required, save a record of your discussion in your course folder.
If required, save a record of your discussion in your course folder.