Section 1
1. Section 1
1.37. Explore
Section 1: Simple and Compound Interest
Explore
You will now look closer at the reasons for the shape of the graphs of simple and compound interest investments.
Try This 2
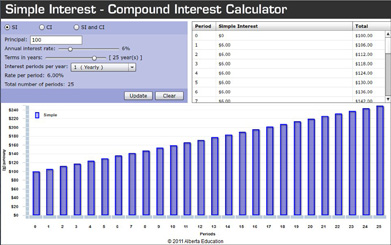
A spreadsheet is a useful tool for comparing the accumulated totals for simple interest and compound interest investments.
- Using the Simple Interest-Compound Interest Calculator, experiment with different interest rates, interest periods, and terms for investments of your choice. Pay careful attention to how the graphs change each time you change the data.

- Complete this Compound and Simple Interest Drag and Drop based on your observations from using the previous spreadsheet.

- Why do the bar heights of compound interest graphs each form a curved increasing line while the bars of simple interest graphs form a straight line?

Simple Interest Bars: The bars forming the graph for simple interest line up in a straight line because the interest added to each column is always based on the original investment. The interest added is constant, so the slope of the line the bars form is also constant.
Compound Interest Bars: The heights of bars forming the graph for compound interest grow at ever-increasing rates because interest is calculated on interest that has been added each year. The interest added is increasing so the slope of the line created by the bars is constantly increasing and creating a curved line.