Section 2
1. Section 2
1.8. Explore 3
Section 2: Slope—Rate of Change
In Try This 3 you may have noticed the connection between a rate of speed and the slope of a graph of the rate. The slope of the distance versus time graph is the same as the speed (rate).
In Try This 4 you will investigate another rate: the number of rotations per minute. You will examine how the speed of the car relates to the size of the wheels and the number of times the wheels turn.

sportscar: Hemera/Thinkstock; sedan: Hemera/Thinkstock
Try This 4
A sports car has a wheel diameter of 20 in. A sedan has a wheel diameter of 17 in. If both cars are travelling at the same speed, which car’s wheels will rotate faster?
- The interactive Sedan Chart shows wheel rotations for the sedan. Complete the table by adding a number and then pressing the Enter key. Each time you press Enter, a point will be added to the graph. You will then see the slope of the line the points define.

- From the table and graph, you can see that in 1 s, the tires rotate 20 times. This gives a conversion factor that looks like
 . It’s read as “20 rotations per 1 s.” This fraction form is a rate. How does this rate compare to the slope of the graph?
The slope is a unit rate since the denominator is 1 s. You can use this unit rate and unit analysis to calculate the number of wheel rotations for any number of seconds. For example, what follows is the calculation for 8 s.

The seconds are abbreviated as s in the numerator and denominator to make it easier to cancel them and leave only the rotations unit.
- Complete the interactive Sports Car Chart and graph for the sports car.

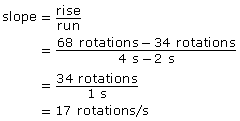
Since you aren’t given the information for 1 s, you need to find the unit rate. Calculate the slope of the graph which will be the unit rate.

 How does the calculated slope compare with the answer from the graph?
Self-Check 2
- Refer to the Sports Car Chart and, from the graph, estimate the number of rotations the sports car's wheels made in 9 s. Answer
- Calculate, using the rotation rate for the sports car, the number of rotations the sport car's wheels made in 9 s. Answer
- How do your answers compare?
 Answer
- Refer to the Sedan Chart and, from the graph, estimate how many rotations the sedan's wheels made in 6.5 s. Answer
- Calculate, using the rotation rate for the sedan, the number of rotations the sedan's wheels made in 6.5 s. Compare your answer with your estimate. Answer
- Answer the following.

For example, use the data for 4 s and 2 s to find the slope of the graph.