Section 2
1. Section 2
1.32. Lesson 4
Section 2: Perspective and Scale
Lesson 4: Interpreting Scale Diagrams
Focus
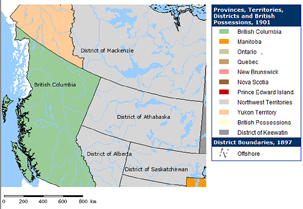
Credit: Atlas of Canada, (Ottawa: Natural Resources Canada, 1990), <http://atlas.nrcan.gc.ca/ > (24 November 2011).
If you look at early maps of Canada, you will notice that political divisions have changed. In 1901, the provinces of Alberta and Saskatchewan did not exist. Alberta and Saskatchewan were just two districts of the Northwest Territories, which stretched from Canada’s Arctic to the American border. As you can see from the map, the District of Saskatchewan spanned over 800 km from parts of present-day Alberta and Manitoba. Without the scale shown on the map, it would be impossible to judge distances or appreciate how large these districts were.
In this lesson you will explore the concept of scale in more detail. You will examine scale on maps and on other scale diagrams.
Lesson Question
In this lesson you will investigate the following question:
- How is proportional reasoning used to solve problems involving scale diagrams?
Assessment
Your assessment for this lesson may include a combination of the following:
- course folder submissions from the Try This and Share sections of the lesson
- your contribution to the Mathematics 20-3: Glossary Terms
- Lesson 4 Assignment (Save a copy of your lesson assignment to your course folder now.)
- the Project Connection
Materials and Equipment
- ruler
- calculator
Time
This lesson has been designed to take 150 minutes; however, it may take more or less time depending on how well you are able to understand the lesson concepts. It is important that you progress at your own pace based on your own learning needs.