Lesson 1
1. Lesson 1
1.5. Explore
Module 1: Probability
Explore

Stockbyte/Thinkstock
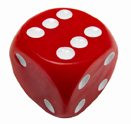
Your table of results from Share 1 may have resembled the one shown.
Outcome |
Frequency |
1 |
5 |
2 |
9 |
3 |
6 |
4 |
11 |
5 |
4 |
6 |
1 |
Total |
36 |
The total of the frequency column represents the total number of times the die was rolled, or the number of possible outcomes.
Looking at the example table given, what was the chance of rolling a 5? What was the chance of rolling a 1? ![]()
In 36 rolls of the die, the chance of rolling a 5 was 4 out of 36,  or 1 in 9 rolls since