Lesson 1
1. Lesson 1
1.4. Discover
Module 3: Algebra
Discover
There are many places where you will find linear relations. In the Math Lab you will investigate if the following relationships are linear relations.
Math Lab
Study the illustration of figures shown. Consider the width, area, and perimeter of each figure. Do you see a pattern?
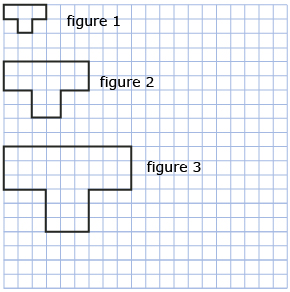
Use the illustration to answer the following questions.
- Use Grid Paper Template or your own graph paper to construct the next two figures, figure 4 and figure 5.
- Complete a table like the one shown. The first two rows have been completed for you.
Figure
Width
Area
Perimeter
1
3
4
10
2
6
16
20
3
4
5
- Graph the data for all five figures using the variables listed. You can graph by hand, electronically by using a spreadsheet, or by using Grid Paper Template.

- perimeter versus figure number
- area versus figure number
- perimeter versus width
- You have now constructed three graphs. In which of these graphs do the points form a straight line? To quickly check for a straight line, try to line a straight edge up to the points.
- What pattern do you notice in the table you completed in question 2?
- Is the pattern from question 5 present for graphs that do not form a straight line?
![]() Save your responses in your course folder.
Save your responses in your course folder.
Share 1
Share your responses and discoveries from Math Lab with a classmate. Be sure to address questions 4 to 6 in your sharing discussion.
![]() Save a summary of your discussion in your course folder.
Save a summary of your discussion in your course folder.
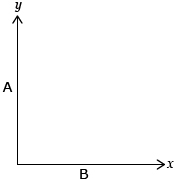
When graphing A versus B, B represents the horizontal axis and A represents the vertical axis.