Lesson 2
1. Lesson 2
1.4. Discover
Module 3: Algebra
Discover

© Dwight Smith /9676362/Fotolia
Try This 1
A truck driver transports lumber from Grande Prairie to Calgary, Alberta. The driver’s map shows that the distance between Grande Prairie and Calgary is about 750 km. The driver knows that she can average 90 km/h, including stops. If she leaves Grande Prairie at 8:00 a.m., will she make it to Calgary by 4:00 p.m.?
- Complete a table of values like the one shown.
Time Travelled
Distance from Calgary (km)
0
750
1
660
2
570
3
4
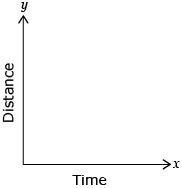
- Using your table of values, create a graph similar to the one shown. Connect the points with a straight line and make sure you extend the line to touch the horizontal axis. You can create a graph by hand, digitally with the use of a spreadsheet, or by using Graph Paper Template.

- Will the truck driver make it to Calgary before 4:00 p.m.? Explain your answer and determine the truck’s arrival time.
![]() Save your responses in your course folder.
Save your responses in your course folder.
Share 1
With a partner or in a group, share your strategy and responses. In your sharing session, consider the following discussion questions.
- What is the slope of your graph?
- What does the slope of your graph represent in the question?
- Why is the slope negative?
- What is the y-intercept of your graph?
- What does the y-intercept of your graph represent in the question?
- In this case, should the points be connected? Explain.