Lesson 3
1. Lesson 3
1.6. Explore 5
Module 3: Algebra
Self-Check 1
Read “Example 1” on page 51 of the textbook. Then complete questions a. to d. at the bottom of the page. Check your answers with the solutions provided on page 52 of the textbook.
Self-Check 2
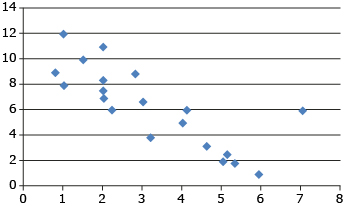
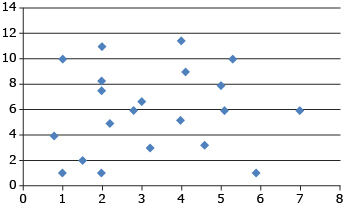
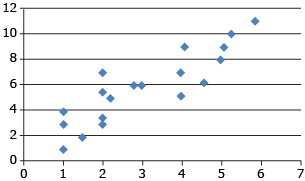
- Describe the correlation for each of the following scatterplots.
- From the scatterplots shown, is there one (or more) that has an outlier? Answer
You have now had some practice in determining and interpreting a line of best fit. When one or two outliers are present, they normally don’t have an effect on the line of best fit.