Lesson 4
1. Lesson 4
1.2. Explore
Module 3: Algebra
Explore

© corepics/34195429/Fotolia
In Discover you probably found that the independent variable is the distance travelled by a cab, and the dependent variable is the cost of the cab ride. Your graph is a linear relation and should have resembled the following graph:
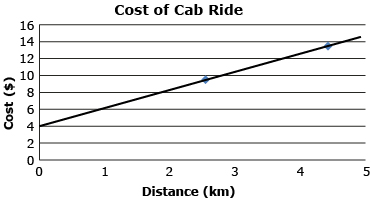
The slope of your graph represents the cost per kilometre and the y-intercept represents the fixed cost. Finding the y-intercept is an example of extrapolation. It would be an example of interpolation to estimate the cost of a 3.5-km trip from the graph.
Try This 2
Respond to “Discuss the Ideas: Forecasting Based on a Trend” questions 1 to 3 on pages 56 and 57 of the textbook.
![]() Save your responses in your course folder.
Save your responses in your course folder.
Share 2
With a partner or in a small group, discuss your responses to Try This 2 and the following question.
- Would this data be accurate for any major Canadian city?
![]() Save your responses in your course folder.
Save your responses in your course folder.
Try This 3
Pick another major Canadian city and research the average house price from 2002 to present. Start your search by entering the name of the city followed by “average house price 2002 to present” in an Internet search engine.
What changes would be made to the slope and y-intercept if a different city were considered? Explain.
![]() Save your responses in your course folder.
Save your responses in your course folder.