Lesson 4
1. Lesson 4
Module 7: Exponents and Logarithms
Lesson 4: Characteristics of Logarithmic Functions
Focus
Medioimages/Photodisc/Thinkstock
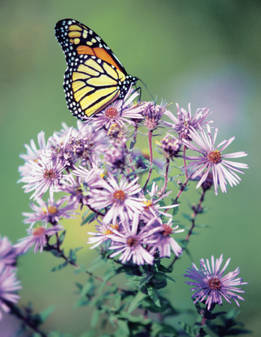
Researchers have discovered that the population of butterflies is dependent on the number of flower species that butterflies feed on. The relationship is a logarithmic function. As the number of flower species increase, so does the number of butterfly observations, but at a slower rate.
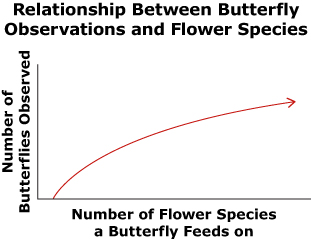
In this lesson you will learn the characteristics of logarithmic functions and their graphs, similar to the graph that shows the relationship between butterfly observations and number of flower species a butterfly feeds on.
Lesson Outcomes
At the end of this lesson, you will be able to
- describe the characteristics of logarithmic functions by analyzing their graphs
- describe the characteristics of logarithmic functions by analyzing their equations
Lesson Question
You will investigate the following question: How can the characteristics of logarithmic functions be described using graphs and equations?
Assessment
Your assessment may be based on a combination of the following tasks:
- completion of the Lesson 4 Assignment (Download the Lesson 4 Assignment and save it in your course folder now.)
- course folder submissions from Try This and Share activities
- work under Project Connection