Lesson 4
1. Lesson 4
1.2. Explore
Module 7: Exponents and Logarithms
Explore
In Try This 1 you compared two exponential relations: y = 10x and x = 10y. In Lesson 3 you learned that y = log10 x is equivalent to x = 10y. In Try This 2 you will explore the characteristics of the graph of y = log10 x and compare them to the characteristics of the graph of x = 10y.
Try This 2
Open the “Logarithmic Functions—Activity A” applet.
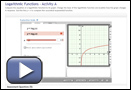
Screenshot reprinted with permission of ExploreLearning.
- Change the a-value to 10 and complete the following chart. Note: You can change the zoom of the graph in “Logarithmic Functions—Activity A” using the buttons on the right of the applet.
Characteristics y = log10 x Domain Range x-intercept y-intercept End Behaviour - How does the graph of y = log10 x compare to the graph of x = 10y you saw in Try This 1?