Lesson 7
1. Lesson 7
1.9. Explore 5
Module 7: Exponents and Logarithms
In Try This 3, you reviewed the characteristics of exponential and logarithmic equations and their graphs. These characteristics are summarized in the following table. You used these characteristics to match equations to their graphs.
| Form | y-intercepts | x-intercepts | Graph Increases | Graph Decreases | |
| Exponential Functions | y = a(b)x | one y-intercept that equals the a-value | no x-intercepts | If b > 1, the graph is increasing. | If 0 < b < 1, the graph is decreasing. |
| Logarithmic Functions | y = a + b ln x | no y-intercepts | one x-intercept | If 0 > b > 1, the graph is increasing. | If 0 > b < 1, the graph is decreasing. |
Self-Check 3
- Complete question 1.a. on page 466 of the textbook. Answer
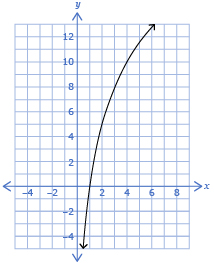
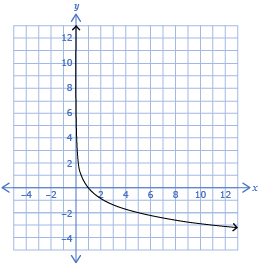
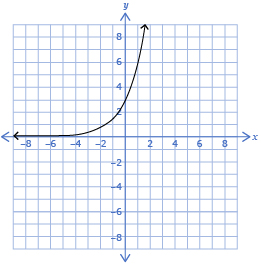
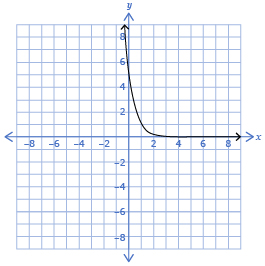
- Match the given functions with the appropriate graphs. Provide an explanation for your choice.
i. y = 3(2)x ii. y = 5 log2 (x) iii. 
iv. y = −2 log5 (x)
Answer
Add the following terms to your copy of Glossary Terms:
- natural logarithm
- logarithmic regression