Module 7 Project
1. Module 7 Project
Module 7 Project
At the Movies
Project Overview
Purpose
In this project you will apply your knowledge and understanding of exponential and logarithmic functions as you analyze data from movie revenue.
Process
Toward the end of each lesson, under Project Connection, you may be prompted to complete a part of the Module 7 Project.
Make sure to save all work from each Project Connection in your course folder. You will submit your entire Module 7 Project to your teacher at the end of Module 7. Make sure to show all your work.
Presentation
The most important part of your project presentation is clearly explaining and supporting your reasoning with relevant visuals and calculations. Make sure to show all your work.
Carefully check the project rubric to be sure you are clear about the expectations for the project.
You can choose any format you prefer for the final presentation of this project. Some options include a written document, virtual or real poster, website, video, oral report, or slideshow presentation.
Project Introduction

iStockphoto/Thinkstock
Do you enjoy going to a movie theatre to watch a movie? Do you have a favourite movie? Many Canadians and Americans go to movie theatres as a form of entertainment. Have you ever wondered how much money a particular movie will make? The revenue for each movie is recorded and is used to judge whether a movie is successful.
In this project you will study how exponential and logarithmic functions can help you to model movie revenue data. You will also look at a logarithmic scale used to measure theatre sound intensity.
Many people in both Canada and the United States go to movie theatres to watch movies. In 2011 the total box office revenue was about $10.1 billion. This was actually a decrease from the yearly revenue in 2010 of about $10.5 billion.
Source: http://boxofficemojo.com/yearly/
In this activity you will analyze box office revenues and see how the data is related to exponential and logarithmic functions.
Part 1: Analyzing Data
The amount of money a movie makes each week it plays in theatres is recorded and referred to as box office revenue. In this activity you will look at the weekly and cumulative box office revenues for different movies.
Activity 1: Weekly Revenue
Following are the U.S. weekly box office revenues for the movie Titanic.
| Time (in weeks) | Weekly Box Office Revenue ($ millions) |
| 1 | 137.1 |
| 2 | 146.5 |
| 3 | 96.9 |
| 4 | 69.9 |
| 5 | 47.7 |
| 6 | 42.0 |
| 7 | 31.1 |
| 8 | 34.1 |
| 9 | 21.2 |
| 10 | 19.6 |
Source: http://boxofficemojo.com/yearly/
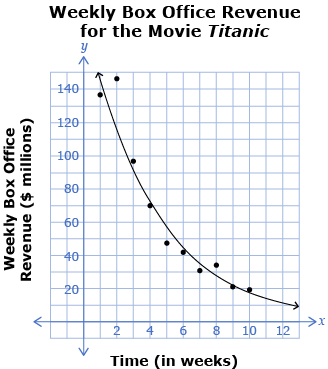
The weekly revenue for the movie over the first 10 weeks was graphed and a curve of best fit was drawn.
- Use the graph Weekly Box Office Revenue for the Movie Titanic to answer the following questions:
- State the domain and range, and explain your answer.
- Does the shape of the curve look more like exponential growth or exponential decay? Justify your answer.
- The equation for the curve graphed is in the form y = abx. Would the b-value of the equation be greater than 1 or between 0 and 1?
- Will there be any x- or y-intercepts? Why or why not? If so, state them.
- Another movie’s weekly box office revenues were analyzed, and the equation that models the data is R = 75(0.8)t, where
- R is the weekly revenue in millions of dollars
- t is the time in weeks
Determine the number of weeks it would take for the weekly box office revenue to be $20 million.
Activity 2: Cumulative Revenue
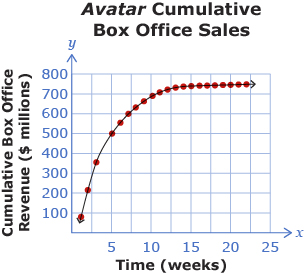
Based on U.S. sales, the movie Avatar (2009) is the all-time highest-grossing film, bringing in more than $750 million in box office revenue. The graph shows the total sales for the movie over time.
Data Source: http://boxofficemojo.com
- State the domain and range, and describe the graph. Be sure to include the following:
- the general shape of the graph
- the domain and range
- any intercepts
- the end behaviour
- Explain why the graph takes the shape that it does.
- Will there be any x- or y-intercepts? Why or why not? If so, state them. If you account for inflation, the all-time highest-grossing film is Gone with the Wind (1939), followed by Star Wars (1977). A model for the cumulative box office revenue for Star Wars is C = 181 log w − 66, where C represents the cumulative box office revenue in millions after w weeks. Compare and contrast the Star Wars sales with the Avatar sales.
Part 2: Logarithmic Scale

Hemera Technologies/Photos.com/Thinkstock
Movie theatres use state-of-the-art sound systems so that moviegoers can fully experience the sound of a movie. The intensity level, β, in decibels (dB), of a sound is defined as ![]() , where
, where
- I is the intensity of the sound in watts per squared metre (W/m2)
- I0 is 10−12 W/m2, the quietest sound that can be heard
- Determine the decibel level of an action movie in a movie theatre that has a sound intensity of 0.01 W/m2.
- To determine the difference in decibel levels, you could use the equation
 . Use a law of logarithms to expand the expression
  .
. - Suppose the decibel level of a romantic comedy can be 75 dB during a particular scene. How many times as loud is the action movie compared to this scene of the romantic comedy? Use the formula
 and solve for
  Use your answer from question 1 as the value of
  . From this question, you know that the value of
  is 75.
 - A horror movie scene is 45 times as intense as the sound of a romance movie scene, which has a decibel level of 65 dB. Determine the decibel level of the horror movie scene. Use the formula
 and solve for
  Use
Use  and
and 
Part 3: Research Movie Revenues
Activity 1: Solving an Exponential Equation

iStockphoto/Thinkstock
For a particular movie, the function that describes cumulative box office revenues is R = –90(0.6)w + 90. Use an algebraic method to determine the week number when the revenue would be $88.5 million. A student started the following solution. Complete the rest of the solution.
Activity 2: Research Your Own Movie
Research the box office revenue of a movie of your choice. Find either weekly box office revenues or weekly cumulative box office revenues for your movie for at least eight weeks.
- Organize your data into a table.
- Make a scatter plot of your data. What shape is the data?
- Perform an appropriate regression on your data, and write your regression equation.
- Use your regression equation to predict the revenue or cumulative revenue value for a time 6 weeks past your last data point
- Use your regression equation to determine one of the following:
- If your data is increasing over time, predict when the box office revenue is 10% higher than your highest revenue value.
- If your data is decreasing over time, predict when the box office revenue is 10% lower than your lowest revenue value.
Conclusion
Write a brief conclusion to your Module 7 Project. Include a personal reflection of what you learned from the project during and after completion. Be sure to explain why you felt the way you did.
Assessment Guidelines
Your Module 7 Project will be evaluated by your teacher using the evaluation guidelines in the project rubric. Read the rubric carefully. Make sure you are aware of how you will be assessed. You can print or save a digital copy of the Module 7 Project Rubric as a guide to help you complete your project.
Don’t forget to submit your completed Module 7 Project at the end of Module 7.