Module 2
1. Module 2
1.35. Page 3
Module 2—The Endocrine System
Pancreatic Hormones
The study of the pancreatic hormones is a significant section of this module. Calcitonin and PTH, which are produced by the thyroid and parathyroid glands, work against each other to control the level of calcium in the blood. Insulin and glucagon, which are produced by the pancreas, are another pair of antagonistic hormones. They work against each other to regulate blood glucose level. Insulin lowers blood glucose levels, whereas glucagon raises blood glucose levels. Together, these hormones maintain homeostasis by way of negative feedback. Restoration to a range of normal glucose levels acts to control hormone secretion.
You may choose to do either the Read activity or the Watch and Listen activity to explore how pancreatic hormones maintain blood glucose levels. If you wish, do both.
 Read
Read
Review pages 456 and 457 of your textbook, which describe how pancreatic hormones maintain blood glucose levels. As you read, make notes. A good summary of negative feedback is given in “Figure 13.25” on page 457 of the textbook. Store your notes, including the feedback loop diagram, in your course folder.
 Watch and Listen
Watch the following two segments of “The Pancreas: Regulating Blood Glucose Levels.” Make relevant notes to be stored for later use. You may be required to enter a username and password to access these videos. Contact your teacher for this information.
- “Blood Glucose Levels”
- “Bio Review: Blood Glucose Levels”
 Try This
It is important to understand the role of insulin and glucagon in the regulation of glucose levels in the blood. To check your understanding, complete the following closed written-response question that has four parts. This format is similar to the closed written-response questions on the Diploma Exam. Notice that mark values have been assigned for each part. The key to this exercise will explain how the mark values are assigned. When you check your answers, mark each part accordingly. These mark values should help you develop comprehensive answers as required on the Diploma Exam. After checking this exercise, file it in your course folder. Consult your teacher if you require clarification or help.
Use the following information to answer question TR 1.
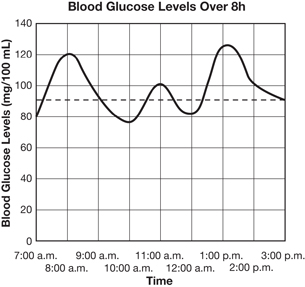
Blood glucose concentrations of one individual were monitored over several hours. The following data was collected. The blood glucose level of a healthy person is approximately 90 mg/100 mL.
|
TR 1. Plot this data on a grid like the one provided below. Draw a curved line through the points and label your graph appropriately. Draw a horizontal dotted line showing the approximate blood glucose level of a healthy individual. (6 marks)

TR 2. On the graph, indicate with an arrow two places where a blood test would reveal high levels of insulin. Explain why insulin would be at high levels at these times. (4 marks)
TR 3. Predict what would happen to this person’s blood glucose levels if he or she worked out at the gym from 9:00 a.m. to 10:00 a.m. With respect to blood glucose levels, how would this person’s body respond? (3 marks)
TR 4. The graph shows that this person’s glucose levels fluctuate throughout the day. Is this person healthy or does he or she have a malfunctioning pancreas? Explain your answer. (3 marks)
 Try This
TR 1. Your graph should look similar to the one shown below.
Marking Guide
1 mark for the title, which must include the manipulated and responding variable
1 mark for correct labels and units on the x-axis
1 mark for correct labels and units on the y-axis
1 mark for using suitable scales for each axis (graph should use the whole grid)
1 mark for drawing a smooth, curved line through the points rather than a jagged line
1 mark for showing the approximate blood glucose level of a healthy individual
TR 2. The first place where insulin levels would be high would be a time somewhere between 7:00 a.m. and 8:00 a.m. This should be marked on the graph with an arrow. (1 mark) This is a time shortly after breakfast. The absorption of glucose from the meal would raise blood glucose levels, and the high glucose levels would stimulate the beta cells in the pancreas to release insulin to lower blood glucose levels back to the normal range. (1 mark for the explanation)
The second place that insulin would be high would be a time somewhere between 12:00 noon and 1:00 p.m. This should be marked on the graph with an arrow. (1 mark) This is a time shortly after lunch. Absorption of glucose from the meal would raise blood glucose levels, and the high glucose levels would stimulate the beta cells in the pancreas to release insulin to lower blood glucose levels back to the normal range. (1 mark for explanation)
TR 3. The muscle cells would use increased amounts of glucose for cellular respiration. (1 mark) As a result, blood glucose levels would start to drop. (1 mark) In response to lower blood glucose levels, the alpha cells in the pancreas would secrete glucagon into the bloodstream. Glucagon stimulates the liver to convert glycogen into glucose, which would be released into the blood to raise blood glucose levels. (1 mark)
TR 4. This individual is healthy according to the levels of blood glucose indicated. (1 mark) If 90 mg/100 mL is considered to be a normal set point, then small fluctuations around the set value are to be expected. (1 mark) It is only if the fluctuations are large and stay above or below the set point continually that the person is considered as having pancreatic dysfunction. (1 mark)