Module 2
1. Module 2
1.37. Page 5
Module 2—The Endocrine System
 Self-Check
Apply what you have learned about diabetes mellitus by completing the following questions. Check your answers and file your work. Consult your teacher for clarification of any concepts you may not understand.
SC 3. Complete the flow chart that illustrates normal blood glucose regulation through negative feedback.
SC 4. Complete a table like the one shown by comparing Type 1 diabetes with Type 2 diabetes.
A Comparison of Type 1 Diabetes with Type 2 Diabetes
| Feature | Type 1 Diabetes | Type 2 Diabetes |
|---|---|---|
| Cause | ||
| Onset | ||
| Age of Onset | ||
| Predisposition | ||
| Insulin Production | ||
| Immediate Symptoms | ||
| Long Term Effects | ||
| Treatment |
SC 5. FMEN 1 wreaks havoc with the levels of Emily’s pancreatic hormones. At different times in her life, tumours have grown in different areas of her pancreas. When tumours affect the beta cells, there is an oversecretion of insulin. Emily then becomes hypoglycemic.
- Differentiate between hyperglycemia and hypoglycemia.
- Describe what happens to the blood glucose level when there is an oversecretion of insulin.
- Outline how a person, such as Emily, reacts to hypoglycemia.
- Explain what other hormone may also be oversecreted as the pancreas tries to deal with the low blood glucose levels.
- What can Emily do to alleviate the symptoms quickly?
Use the following graph to answer question SC 6.
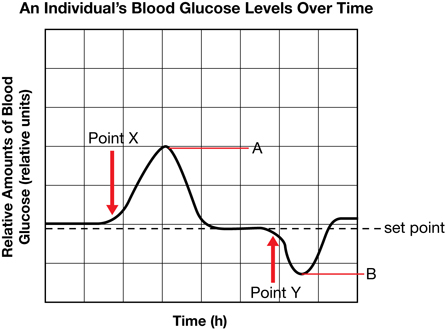
SC 6.
- What occurred at Point X?
- Identify the endocrine secretion represented by A.
- What happened at Point Y?
- Identify the endocrine secretion represented by B.
Self-Check Answers
SC 3. The completed flow chart representing normal regulation of blood glucose through negative feedback should resemble the following.

SC 4. The table comparing Type 1 and Type 2 diabetes should resemble the following.
A Comparison of Type 1 Diabetes with Type 2 Diabetes
| Feature | Type 1 Diabetes | Type 2 Diabetes |
|---|---|---|
| Cause | autoimmune disease where antibodies destroy beta cells in pancreas and little or no insulin is produced |
receptors on target cells do not respond to the insulin produced; insulin resistance develops |
| Onset | rapid |
gradual |
| Age of Onset | childhood |
adulthood, although more cases in young people recently |
| Predisposition | none known |
obesity increases risk of development significantly |
| Insulin Production | very little or none |
insulin produced but ineffective |
| Immediate Symptoms | fatigue, low energy, glucose in urine, increased volume of urine, increased thirst, weight loss, smell of nail polish on breath |
fatigue, low energy, glucose in urine, increased volume of urine, increased thirst, no smell of nail polish on breathe |
| Long Term Effects | blindness, kidney failure, nerve damage, gangrene, increased risk of heart attack and stroke |
blindness, kidney failure, nerve damage, gangrene, increased risk of heart attack and stroke |
| Treatment | insulin injections, islet transplantation in experimental stages |
control diet, lose weight, increase exercise, drugs to decrease insulin resistance |
SC 5.
- Hyperglycemia occurs when blood glucose levels rise significantly over normal values and stay at an elevated level. This condition is usually caused by a lack of insulin. Hypoglycemia occurs when blood glucose levels fall significantly below normal values and are not raised. This condition is caused by the oversecretion of insulin.
- When there is an oversecretion of insulin, cells are stimulated to take up large amounts of glucose and the liver and muscle cells are stimulated to convert large amounts of glucose to glycogen for storage. Adipose (fat) cells are stimulated to convert glucose to fat. All actions significantly lower blood glucose levels below normal values.
- When a person, such as Emily, is hypoglycemic, he or she becomes anxious, nervous, develops trembling in his or her hands, and has a feeling of weakness. Insufficient glucose to the brain cells causes disorientation, which may progress to convulsions, coma, and possibly death.
- Through negative feedback, low blood glucose levels stimulate the alpha cells in the pancreas to secrete glucagon, which instructs cells to convert glycogen back to glucose as well as to convert non-carbohydrates such as fats and proteins to glucose.
- Emily can raise her blood glucose levels by eating something with a lot of glucose in it or she can inject glucagon.
SC 6.
- At Point X, the person ate something with sugar in it.
- A represents the secretion of insulin by the pancreas.
- At Point Y, the person probably did some exercise.
- B represents the secretion of glucagon by the pancreas.