Module 8
1. Module 8
1.45. Page 3
Module 8—Populations, Individuals, and Gene Pools
Growth Curves, Reproductive Strategies, and Population Change
In this lesson you’ve learned that species that use the r-selected reproductive strategy reproduce exponentially and have J-shaped growth curves. Similarly, species that use the K-selected reproductive strategy reproduce logistically and have S-shaped growth curves. These concepts can be related to population change, which was the focus of the first part of the unit.
Natural selection favours the members of a population that have phenotypes/alleles that are best suited for survival in an environment. But where on the population growth curve does natural selection begin to have its effect? Think about the following statement: “There are no winners without a competition.” Competition in natural populations only begins when the going gets tough—specifically, when food starts to run out, nesting space and territory is limited, wastes accumulate, disease breaks out, and predator numbers climb. These density-dependent limiting factors set the stage for survival of the fittest.
Look at the logistic growth curve and consider where on this curve competition and selection for superior alleles begins. This is where population change or microevolution occurs as those organisms with superior physical, biochemical, and behavioural traits continue to live and reproduce while those around it do not. Use this information to complete the following Self-Check activity.
 Self-Check
Using the following graph illustrating exponential and logistic growth, answer the questions. Check your work and file your answers in your course folder.
Logistic (S) vs. Exponential (J) Growth Curves
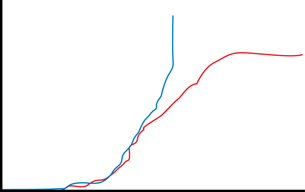
SC 2. Label the region as (A) on the logistic curve where you would expect there to be the greatest competition and, therefore, selection of favourable alleles. Support your answer.
SC 3. Label the region as (B) on the logistic graph where you would expect to see the highest concentration of “winners”—those with the most favourable alleles that have been naturally selected for. Support your answer.
SC 4. Label the region as (C) on this graph where you would expect to see the predator-prey cycles that were discussed in a previous lesson occurring. Support your answer.
Self Check Answers
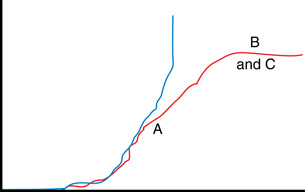
SC 2. During this period, environmental resistance is high due to the competition that results from scarcity and other density-dependent factors. Competition is weeding out the unfavourable alleles and increasing the frequency of favourable alleles.
SC 3. At carrying capacity (the stationary phase of the logistic growth curve) the alleles that are present are those of the “survivors”—those that have survived the competitive weeding-out process and have been naturally selected.
SC 4. At carrying capacity the number of prey is held in check by the number of predators. However, the reverse is also true. High prey numbers result in high predator numbers, which lead to low prey numbers and, in turn, to low predator numbers. So, the two populations cycle together, helping to keep populations at carrying capacity.
Self-Check
To review your skills with r- and K-selected life strategies, complete the following questions.
SC 5. K-selected species typically have all of the following characteristics EXCEPT
- large size
- nurture their young
- reproduce early in life
- live in stable environments
- controlled by density-independent factors
- able to grow at their biotic potential
- likely to show boom and bust population cycles
- all of the above
- large body size
- late reproductive age
- stable environment
- large number of offspring
- display a J-shaped growth curve
- display an S-shaped growth curve
- show logistic growth
- stabilize at a population number called the carrying capacity
- humans
- mosquitoes
- bees
- ducks
Self-Check Answers
SC 5. C
SC 6. D
SC 7. D
SC 8. A
SC 9. B