Module 5 Intro
1. Module 5 Intro
1.33. Page 4
Module 5—Acids and Bases
 Read
Read
Estimating the pH of Solutions Using Indicators
Indicators can be used as an inexpensive method to estimate the pH of a solution. You may have noticed as you completed the previous Self-Check questions that a single indicator only provides limited information about pH. When estimating pH, more than one indicator is used. Work through the following example to see how indicators are used to estimate the pH of a solution.
Example: A solution is tested with three indicators. The results are summarized in the following table. Estimate the pH of this solution.
Indicator |
Colour |
bromothymol blue |
blue |
phenolphthalein |
colourless |
phenol red |
red |
Step 1: Use the Acid-Base Indicators table to determine the pH range.
Acid-Base Indicators at 298.15 K
Indicator |
Suggested Abbreviation(s) |
pH Range |
Colour Change as pH Increases |
Ka |
methyl violet |
HMv(aq)/Mv–(aq) |
0.0–1.6 |
yellow to blue |
~2 × 10⁻¹ |
bromothymol blue |
HBb(aq) / Bb–(aq) |
6.0–7.6 |
yellow to blue |
5.0 × 10⁻⁸ |
phenol red |
HPr(aq) / Pr–(aq) |
6.6–8.0 |
yellow to red |
1.0 × 10⁻⁸ |
phenolphthalein |
HPh(aq) / Ph–(aq) |
8.2–10.0 |
colourless to pink |
3.2 × 10⁻¹⁰ |
According to the table, the three indicators show the following:
- bromothymol blue: blue = above pH 7.6
- phenolphthalein: colourless = below pH 8.2
- phenol red: red = above pH 8.0
Step 2: Use a number line to narrow the range of pH values.
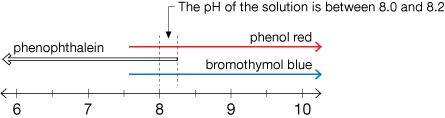
The estimated pH of the solution is between 8.0 and 8.2.
 Self-Check
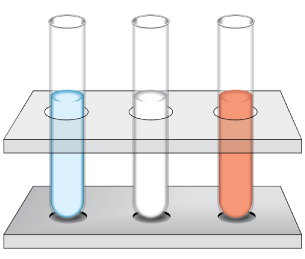
SC 5. Three test tubes with 5 mL of the same solution are in a test tube rack. A different indicator is added to each test tube. Here are the results.
Test Tube |
Indicator |
Colour |
1 |
phenolphthalein |
colourless |
2 |
cresol red |
yellow |
3 |
chlorophenol red |
red |
Use the data to estimate the pH of the solution.
Self-Check Answers
SC 5. According to the data, the three indicators show the following:
- phenolphthalein: colourless = below pH 8.2
- cresol red: yellow = below pH 7.0
- chlorophenol red: red = above pH 6.8