Module 7 Intro
1. Module 7 Intro
1.15. Lesson 3 Intro
Module 7—Chemical Analysis
Lesson 3—Titration Curves and Selecting Indicators
 Get Focused
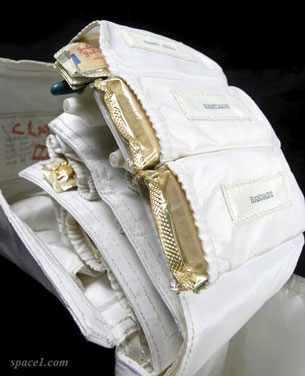
Courtesy of Johnson Space Center/NASA
Legend has it that Neil Armstrong, the first man to walk on the Moon, was reluctant to go into space unless Aspirin was included on the mission. Aspirin tablets—used for relieving headaches and muscle pain—were included in the medical kit (shown here) of the Apollo 11 space capsule and for later space missions. The key ingredient in Aspirin is acetylsalicylic acid (ASA).
As you have discovered, titration is a process that can be used to determine the quantity of a substance in a sample. In this lesson you will learn more about the stoichiometry involved in the process of titration and why titration can provide such accurate and reliable data in quantitative analyses. You will also perform a titration of pain-relief tablets to determine the mass of ASA present.
Essential Questions
-
How are titration graphs drawn?
-
How do you select an appropriate indicator for a titration?
 Module 7: Lesson 3 Assignment
Save a copy of the Module 7: Lesson 3 Assignment to your course folder. Later in the lesson you will receive more information about how to complete this assignment and when to submit it to your teacher.
You must decide what to do with the questions that are not marked by the teacher.
Remember that these questions provide you with the practice and feedback that you need to successfully complete this course. You should respond to all the questions and place those answers in your course folder.