Module 7 Intro
1. Module 7 Intro
1.17. Page 3
Module 7—Chemical Analysis
 Read
Read
The unique shape of a titration curve demonstrates that important changes occur. Interpreting the different parts of a titration curve is an important skill. Read the first four paragraphs of “Interpreting Titration pH Curves” on pages 334 and 335 of the textbook.
 Self-Check
SC 1. Retrieve the extra copy of the titration curve you saved to your course folder. Find the equivalence point and equivalence point pH for each titration curve. Using your labelled graphs, state the equivalence point pH and volume of titrant required to reach the equivalence point for each titration. Save your answer for use later in this lesson.
![]() Self-Check Answer
Self-Check Answer
SC 1.
Titration |
Equivalence Point pH |
Volume of Titrant to Reach Equivalence Point |
HCl(aq) vs. NaOH(aq) |
6.75 |
15.2 mL |
CH3COOH(aq) vs. NaOH(aq) |
8.75 |
4.0 mL |
Read
Read the rest of “Interpreting Titration pH Curves” on page 335 of your textbook.
You will note that a titration curve conveys a great deal of information about the chemical reaction that occurred to produce this data.
Axes Labels: The x-axis represents the volume of titrant added to the sample (usually in mL). The y-axis represents the pH of the sample as the titration progresses.
Title: The title identifies the reactants.
A very important piece of information on the graph is the equivalence point. The equivalence point represents the end of the reaction and is located at the midpoint of the steep middle region. While the titration graph for a strong monoprotic acid reacting with a strong monoprotic base will have an equivalence point pH of 7, this is not necessarily the case for weak acids or weak bases being titrated.
The volume of titrant required to reach the equivalence point is the value used to complete calculations like those you have completed in the previous lessons.
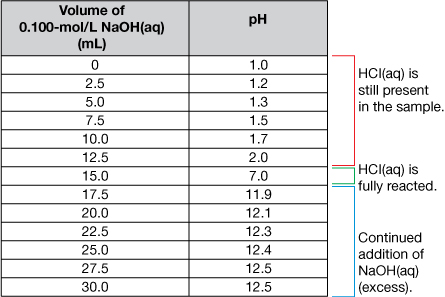
The titration data and the completed titration curve are shown here for comparison.
Selecting Indicators for a Titration Curve
If you titrate HCl(aq) with NaOH(aq)—two colourless solutions—without using an indicator, there will be no colour change to signify that the equivalence point has been reached. Indicators respond to changes in pH and provide a dramatic colour change to signify the endpoint of a titration. But with so many indicators to choose from, which one is best?
Read “Choosing Acid-Base Indicators for Titration” on page 336 of your textbook.
A good rule of thumb for selecting an indicator is that the midpoint pH of the range of colour change is equal to the equivalence point pH.
Self-Check
SC 2. Retrieve the copy of the titration curve that you used in SC 1. Use the information provided in the “Acid-Base Indicators” table in the Chemistry Data Booklet to identify suitable indicators that will signify the endpoint for the titration shown. Then indicate the colour change that would signify the endpoint of the titration.
Self-Check Answer
SC 2.
Titration |
Suitable Indicator |
pH of Indicator |
Colour Change at Endpoint |
HCl(aq) vs. NaOH(aq) |
bromothymol blue |
6–7.6
6–8.0 |
green (intermediate between yellow to blue) orange (intermediate between yellow and red) |
CH3COOH(aq) vs. NaOH(aq) |
thymol blue phenolphthalein |
8–9.6
8–10.0 |
green (intermediate between yellow to blue) pink |
 Module 7: Lesson 3 Assignment
Retrieve the Module 7: Lesson 3 Assignment you saved earlier in this lesson. Complete questions 2, 3, and 4. Save a copy of your assignment to your course folder.