Module 2
1. Module 2
1.20. Page 4
Module 2—The Conservation of Momentum in Isolated Systems
 Reflect and Connect
Maps courtesy of ERCB/AGS
The Alberta Traffic Safety Plan reports the following statistics:
-
A traffic collision occurs every five minutes in Alberta.
-
On average, one person is killed and 65 injured in collisions every day.
-
Collisions kill six times as many people as homicide, eight times as many as AIDS, and 100 times as many as meningitis.
-
The costs associated with collisions in Alberta are $12 million per day, or more than $4 billion per year.
The statistics indicate that collisions are common and have significant costs both to property and people.
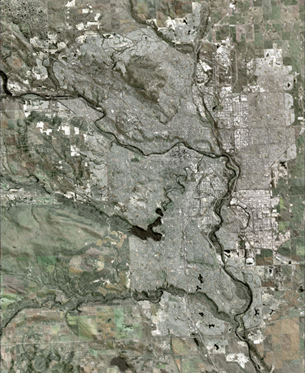
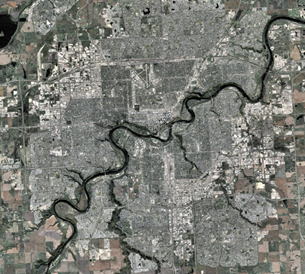
An intersection is essentially a planned point of conflict. Two roads, travelling in different directions, meet with drivers travelling in a variety of directions. The greater the number of points of conflict, the greater the number of collisions.
To understand the scope of this problem, open an online map site that allows a satellite view. Then find your house. Use the satellite view, and zoom in as far as you can with a clear satellite image. How many intersections are in your neighbourhood? Now find the intersection of 75th street NW and 98th Avenue NW in Edmonton by entering the address in the search area. Zoom out and look at more of the city. How many intersections do you think there are? Now try the intersection of 17th Avenue SW and 14th Street SW in Calgary. In cities such as Edmonton and Calgary, there are many intersections.
Maps courtesy of ERCB/AGS
Reflect on the Big Picture
© Katherine Welles/shutterstock
Recall the collision of Kathy and Bill in the Big Picture section. Based on what you learned in this lesson, continue to analyze this collision.
Complete your Module 2 Project. Add the following questions and answers to your Crash Analysis stored in your Physics 30 course folder.
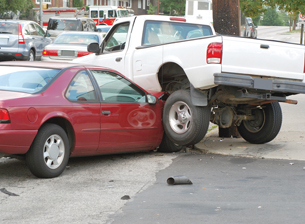
In previous lessons you determined the magnitude of the momentum of the combined vehicles just after impact and the kinetic energy before and after the impact. The following vector diagram illustrates the direction of the momentum vector based on evidence from the scene.
The two momentum vectors before the collisions are represented in blue. The momentum after the collision is in red. Adding the two momentum vectors before the collision equals the momentum after the collision, according to the law of conservation of momentum.
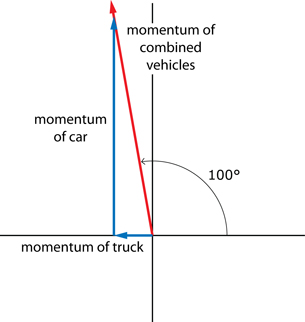
While the photo suggests a much more complex collision than the given diagram, assume that the diagram shows exactly what happened.
-
Using this vector diagram and your calculated value for the momentum of the combined vehicles, verify the police calculations and determine the momentum and velocity of Bill’s truck just before the collision. (Analytic)
-
Using this vector diagram and your calculated value for the momentum of the combined vehicles, verify the police calculations and determine the momentum and velocity of Kathy’s car just before the collision. (Analytic)
-
Does your analysis prove, beyond a reasonable doubt, that Kathy was, in fact, travelling at the speed limit of 50 km/h just prior to the accident? What assumptions did you make in your solution to determine this? (Holistic)
Before submitting your answers for your Module 2 Project double check your answers with the following rubrics:
Scoring Guide for Analytic Questions
Scoring Guide for Holistic Questions
Answering these questions completes your Module 2 Project. Submit your Crash Analysis to your teacher for marks.
 Module 2: Lesson 3 Assignment
Remember to submit the following to your teacher:
- Module 2: Lesson 3 Assignment
- Module 2 Project