Lesson 1: Sketching and Interpreting Graphs
| Site: | MoodleHUB.ca 🍁 |
| Course: | Mathematics 10C |
| Book: | Lesson 1: Sketching and Interpreting Graphs |
| Printed by: | Guest user |
| Date: | Friday, 19 December 2025, 5:25 AM |
Module 4: General Relations
Lesson 1: Sketching and Interpreting Graphs
Focus
© Val Thoermer/shutterstock
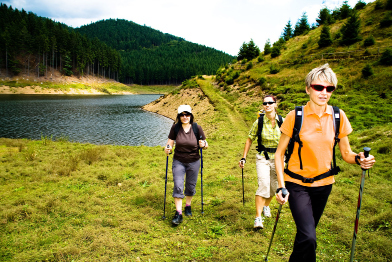
Walking is an outdoor activity that can be enjoyed by people of all ages and fitness levels. You can walk at a brisk pace as a form of exercise, or you can go more slowly to take in the natural surroundings. Walking can be done in all kinds of weather.
Walking is a fun way to get fit and socialize, but did you know that it is also a competitive sport? Do an Internet search using the keywords “race walking” or “speed walking” to find out more about this sport. See if you can find out how a race walker distinguishes between fast walking and running.
Assume that you went for a two-hour hike. If you were to graph your progress, what variables would you consider? If you graphed your total distance travelled versus the time elapsed, what would your graph look like? How would you represent the parts of the hike that were faster or slower? How would you represent the rest periods?
In this lesson you will review how to create a graph. In addition, you will interpret graphs. You will match graphs to possible scenarios, and you will read a scenario and sketch a possible graph to fit the outline.
Outcomes
At the end of this lesson, you will be able to do the following:
-
Identify independent and dependent variables in a given context.
-
Describe a possible situation for a given graph.
-
Sketch a possible graph for a given situation.
Lesson Questions
-
How do you know whether a variable is dependent or independent?
-
How can a graph be used to describe a situation?
 Lesson Completion and Assessment
As you work through each lesson, complete all the questions and learning activities in your binder using paper and pencil, clearly labeling your work (they refer to this as your course folder). These include the Are you Ready, Try This, Share and Self Check questions. Check your work if answers are provided. Remember that these questions provide you with the practice and feedback that you need to successfully complete this course.
Once you have completed all of the learning activities, take the Lesson Quiz. This is the assessment for each lesson and is located under the Assess tab or by using the Quizzes link under the Activities block.
** Note – Share questions may have to be done on your own depending on your learning situation**
Module 4: General Relations
Launch
This section checks to see if you have the prerequisite knowledge and skills to be able to complete this lesson successfully.
Are You Ready?
Complete these questions in your course folder (binder). If you are experiencing difficulty, you may want to use the information and the multimedia in the Refresher section to clarify concepts before completing these exercises.
Print and complete or copy by hand and complete.
Lesson 1: Are you ready?Once you have completed these exercises to the best of your ability, use the provided answer link to check your work.
Answers
If you feel comfortable with the concepts covered in the questions, move forward to Discover. If you experienced difficulties or want more practice, use the resources in Refresher to review these important concepts before continuing through the lesson or contact your teacher.
 Refresher
The purpose of this section is to provide you with some resources to review in preparation for the lesson ahead. These resources may include videos, interactive applets, mini-lessons, and flash games to help you recall previously learned concepts. You can use these resources either before or after you try the questions in Are You Ready? Your teacher may also direct you to this section to review specific concepts.
For a review of the (x, y) notation and the coordinate plane, work through the multimedia piece found at the Math Continuum website.
Under the heading “Patterns and Relations,” choose “Graphing Patterns (Puzzles)” and work through the examples. Click on topics and then each topic if the MM piece does not automatically run for you.

Use the “School Ski Trip” applet to review line graphs.

Use the "Math Goodies" website to review how to make an accurate graph from a data table.

Materials
-
ruler
-
“Graph Paper Template”
Module 4: General Relations
Discover
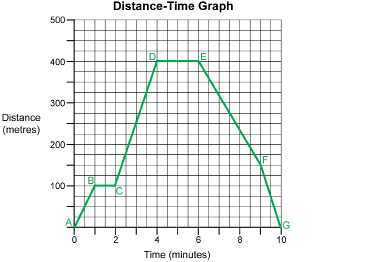
A graph’s properties can provide clues about a particular situation. The properties of a distance-time graph are illustrated in the following graph, which shows the progress of a person’s hike.

© Brian Goodman/shutterstock
 Try This 1 - 9
Answer the following questions based on the distance-time graph above.
Complete the following in your course folder ( binder).
TT 1. How long does it take to get from point A to point B?
TT 2. How far is it from point A to point B?
TT 3. How fast is the person moving from point A to point B in metres per second?
TT 4. How long does it take to get from point B to point C?
TT 5. How far is it from point B to point C?
TT 6. What is happening during the time that the person is moving from point B to point C?
TT 7. How fast is the person moving from point C to point D in metres per second?
TT 8. How far away is the person from the start point once he or she has reached point G?
TT 9. How many metres has the person hiked during the entire trip?
Check your answers by using the provided answers below.
Possible TT1 - 9 (Try This 1 - 9) Answers
Module 4: General Relations
Explore

© Rohit Seth/shutterstock
Soaking in a hot tub is a good way to relax after strenuous exercise or to finish off a long day. The water relieves muscle tension and reinvigorates the body.
The level of water in a hot tub is fairly constant. Of course, the water level changes when the tub is being filled and when it is drained. In addition, the water level rises as people get into the tub and drops as they get out. This level change is due to the displacement of water. You can track the water level of a hot tub on a graph.
In this lesson you will learn about independent and dependent variables. You will also learn how to describe a scenario to fit a graph, and you will sketch a graph to fit a description.
Glossary Terms
Add the following terms to your "Glossary Terms" in your notes. You may also want to add examples that demonstrate how each of these terms is applied:
-
dependent variable
-
distance-time graph
-
independent variable
-------------------------------------------------------------
Independent and Dependent Variables
A graph is usually constructed on a coordinate plane consisting of a vertical axis, or y-axis, and a horizontal axis, or x-axis. The graph will show the relationship between two variables—the independent variable and the dependent variable.
The independent variable is the quantity that is not dependent on the other variable. The independent variable is also the variable for which values are selected.
The dependent variable is what changes when the independent variable changes. In other words, the dependent variable depends on the outcome of the independent variable. It is the variable that reflects the influence of the independent variable.
 Watch and Listen
Watch the video titled “Graphic Representations”.

This video shows an example of how you can interpret the independent and dependent variables in a given context. As you watch the video, focus on where the independent variable and dependent variable are placed on a graph.
Example
Isabel designs an experiment to measure the growth rate of plants. She exposes two different groups of plants to different amounts of sunlight per day. One group receives 8 hours of sunlight per day, and the second group receives only 4 hours of sunlight per day. Isabel monitors the growth of the plants in each group over a period of one month by recording the heights of the plants on a daily basis.
Identify the independent and dependent variables in the scenario.

left: © Elnur/shutterstock, middle: © Andresr/shutterstock,
right: © Marcin Balcerzak/shutterstock
Solution
The independent variable is the duration of sunlight exposure. The dependent variable, or the variable that depends on the number of hours of sunlight exposure, is the growth of the plants.
 Read
Read
In your textbook you will find brief definitions of independent and dependent variables. As you read this short section in the textbook that you are using for this course, pay attention to how independent and dependent variables are recorded in a table.
Foundations and Pre-calculus Mathematics 10 (Pearson)
Read the text and the table at the top of page 267.
 Self-Check
Identify the independent and dependent variables in each scenario.
SC 1. Imagine you wish to know whether studying with a partner will increase your exam scores. You randomly assign each participant in this experiment to either an experimental condition or a control condition. In the experimental condition, participants study in pairs. In the control condition, the participants study by themselves.
SC 2. Now imagine you wish to know whether a one-page or a two-page resumé is more persuasive. You randomly assign each participant to read a one-page or two-page resumé, and then they make a judgement about whether the person should be hired for a job.
 Tip
Tip
One way to distinguish between an independent variable and a dependent variable is to try making a sentence using the variable names.
(Studying with Others) causes a change in (Exam Score), and it isn’t possible that (Exam Score) could cause a change in (Studying with Others).
You see that “Studying with Others” must be the independent variable and “Exam Score” must be the dependent variable because the sentence doesn’t make sense the other way around.
 Try This 10
Complete the following in your course folder ( binder).
Compare the variables in each pair. Decide which quantity depends on the other. The first row has been done as an example.
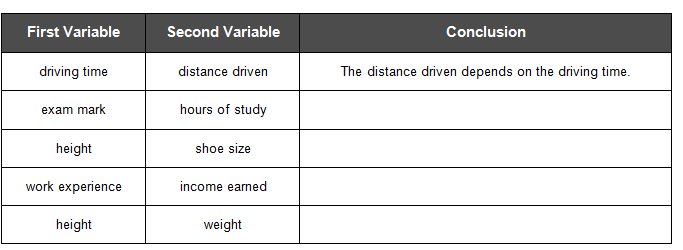
Use the link below to check your answers to Try This 10.
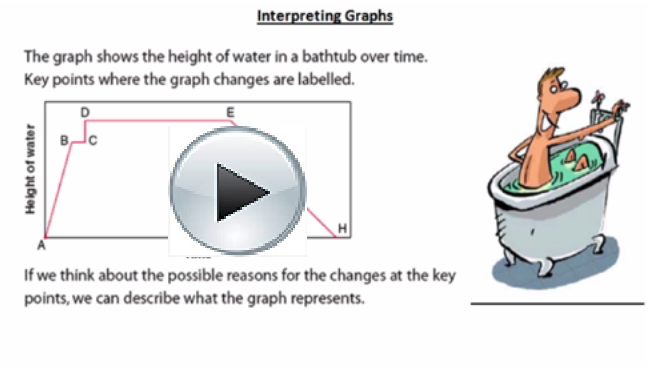
Interpreting Graphs
Graphs are a great way to present information visually. A well-constructed graph can be a source of information that is easy to read and understand and is also pleasing to the eye. The patterns in a graph, however, still need to be interpreted correctly in order for it to be useful. Interpreting graphs is a skill that requires some practice. The next part of this lesson focuses on interpreting graphs.
Example
Consider this scenario: Jasmine pedals her bicycle up a hill and then down the other side of the hill.

For each of the following pairs of graphs, decide which graph best represents the scenario. State reasons to support your answer.
- Which of the following height vs. time graphs would best represent the scenario?

- Which of the following speed vs. time graphs would best represent the scenario?
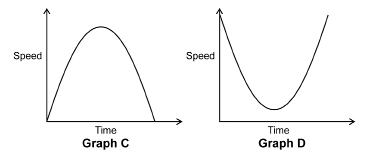
Solution
- As Jasmine pedals uphill, her height relative to her starting position increases. Once she reaches the top, Jasmine then begins to descend downhill. Therefore, the graph that shows an increase followed by a decrease is Graph A.
- As Jasmine pedals uphill, her speed decreases since gravity is working against her and slowing her down. As Jasmine moves downhill, her speed increases since gravity is working with her. Therefore, the graph that shows a decrease followed by an increase is Graph D.
|

 Watch and Listen
Watch the “Interpreting Graphs” video below to see some solved examples.
Describe a Scenario to Fit a Graph
 Try This 11 - 15
Complete the following in your course folder ( binder).
TT 11. Consider the graph shown. Create a scenario to describe what is happening in the graph. Be sure to account for each line segment in the graph. You are free to add any extra details.

AB: _________________________________________________
BC: _________________________________________________
CD: _________________________________________________
TT 12. In your scenario, how far apart are points A and D? (You may want to add a scale to each axis to provide more detail to your scenario.)
TT 13. Sections AB and CD are both diagonal line segments, but one is steeper than the other. How does your description account for the difference?
TT 14. How should a horizontal segment such as BC be interpreted in a distance-time graph?
TT 15. How would the scenario you described be different if the label on the vertical axis was changed to “Speed”?
Use the link below to check your answers to Try This 11 - 15.
 Read
Read
In your textbook you will find an example demonstrating how to interpret the various parts of a distance-time graph. As you read, see if you can determine the answers to the following questions.
Foundations and Pre-calculus Mathematics 10 (Pearson)Read “Example 2: Describing a Possible Situation for a Graph” on page 279. How can you explain the difference in the length of segment AB compared to segment CD? What is the relationship between the start point and point E? How do you know? |
Mathematics 10C Learn EveryWare © 2010 Alberta Education
Sketch a Graph to Fit a Description

© Dmitriy Shironosov/shutterstock
A graph is a great way to summarize a description of an event or a situation. Using a graph has several benefits. One benefit is that graphing makes the description more visual and, therefore, more engaging. Another benefit is that a graph can capture multiple aspects of a situation in a concise manner, whereas it may take many sentences to describe one aspect of the scenario. A third benefit is that a graph can be used as a tool to analyze trends and uncover patterns.
In this part of the lesson you will learn how to convert descriptions of scenarios into graphs.
 Read
Read
Read the example in your textbook that shows how you can construct a graph based on a description of a scenario.
|
Foundations and Pre-calculus Mathematics 10 (Pearson) Read “Example 3: Sketching a Graph for a Given Situation” on page 280. How is a horizontal segment on a speed-time graph different than a horizontal segment on a distance-time graph? |
 Watch and Listen
Watch the “Creating a Graph” video below for an example of how to create a line graph.

 Try This 16
Complete the following in your binder.
Foundations and Pre-calculus Mathematics 10 (Pearson)
TT 16. Complete “Exercises” questions 3, 5, 6, 10, 13, and 14 on pages 281 to 283.
Use the link below to check your answers to Try This 16.
Module 4: General Relations
Connect
 Lesson Assessment
Complete the lesson quiz posted under the Assess tab or by using the Quizzes link under the Activities block. Also, ensure your work in your binder (course folder) is complete.
 Project Connection ** NOT ASSIGNED**

© iofoto/shutterstock
In this module you are focusing on sports and recreation. You may choose to answer the questions or contact your teacher if you would prefer to create a graph about a different scenario of your choice.
In hockey, there are many events that can be graphed—for example, number of wins for a team, number of goals for a player, number of penalty minutes. The graphs can help players, coaches, and fans see patterns and trends in the numbers. These patterns allow people to make more informed decisions.
Now it is your turn to create graphs. Your graphs may be based on hockey, or you may choose a sport or recreational activity that is of more interest to you.
Go to the Unit 3 Project, and complete the Module 4: Lesson 1 component.

© DPiX Center/shutterstock
 Going Beyond
In 2009, the H1N1 flu was a large concern. The following graph illustrates the course of the H1N1 flu virus outbreak in Canada. (The graph, produced by the Public Health Agency of Canada, is current as of June 8, 2009.) The illustraton shows either the date when symptoms of the H1N1 flu virus began or, if this date was not available, the date when a specimen was collected for each of the laboratory-confirmed cases.
H1N1 Flu Graph
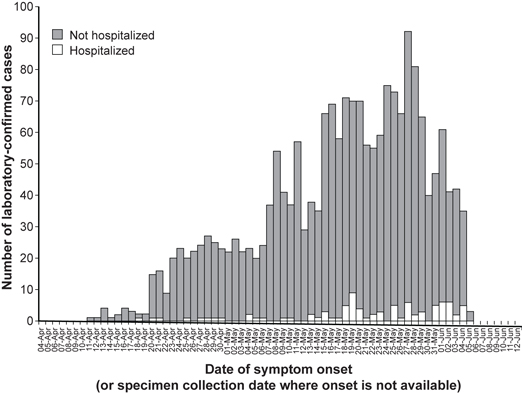
Source: Date of Symptom Onset,  , Public Health Agency of Canada, 2009.
Reproduced with the permission of the Minister of Public Works and Government Services Canada, 2010.
Click here to view a larger image.
- When reading a graph such as this one, what do you think is important to keep in mind?
- What are some possible sources of confusion or misrepresentation?
Perform an Internet search for other graphs that show growth over time. You may find a graph that also provides data from the health sector, or you may find a graph that could be from another industry.
Module 4: General Relations
Lesson 1 Summary
In this lesson you investigated the following questions:
- How do you know whether a variable is dependent or independent?
- How can a graph be used to describe a situation?
In this lesson you learned that when two quantities are compared, one is the independent variable and the other is the dependent variable. The independent variable is the variable for which values are selected. The values of the dependent variable are determined based on the independent variables. You analyzed different contexts to practise identifying dependent and independent variables. You used the technique of making a sentence with the variable names to help you decide which variable is dependent on the other.
In this lesson you also examined graphs and explored how you can interpret graphs based on their features. You studied distance-time and speed-time graphs and learned how to interpret horizontal segments, vertical segments, and diagonal segments. You learned that a graph can describe many characteristics of a situation.
In Lesson 2 you will examine relations. You will learn to recognize when it is appropriate to connect the points of a graph and when it is inappropriate to do so. You will also learn two other words to describe the values of the dependent and independent variables.