Lesson 2: Relations
| Site: | MoodleHUB.ca 🍁 |
| Course: | Mathematics 10C |
| Book: | Lesson 2: Relations |
| Printed by: | Guest user |
| Date: | Friday, 19 December 2025, 5:23 AM |
Module 4: General Relations
Lesson 2: Relations

Hemera/Thinkstock
Focus
Two of the best tennis players in recent history are sisters Venus and Serena Williams. As of 2010, Venus, the older sister, has won 21 Grand Slam titles and three Olympic gold medals. Younger sister Serena Williams has won 27 Grand Slam titles and three Olympic gold medals. Both sisters have been ranked as the best female tennis player in the world on many occasions by the World Tennis Association.
Some of the most exciting tennis matches have been those where the sisters squared off in a Grand Slam final! Grand Slam events include the French Open, the Australian Open, the United States Open, and Wimbledon.
Examples of athleticism in families are also found in other sports. Whether it’s the Sutter hockey family from Alberta or the Reed figure skating family or the Manning American football family, each example makes a good case for athletic talent. In many cases, this talent has been passed on from one generation to the next.
Many people are interested in genealogy, or the study of family ancestry and histories. Genealogy involves the creation of family trees. A family tree allows you to see not only who you are related to, but how you are related to other people.
Consider the following family tree. How is Sarah related to Ann and Paul? to Emily? to George? to Amelia? to Henry and Dianna? to William and Mary?

In this lesson you will work with mathematical relations.
Outcomes
At the end of this lesson, you will be able to
-
explain why data points should or should not be connected on the graph for a situation
-
determine and express, in a variety of ways, the domain and range of a graph, a set of ordered pairs, or a table of values
-
graph, with or without technology, a set of data and determine the restrictions on the domain and range
Lesson Questions
-
Why is it appropriate to connect the points on some graphs but not others?
-
How can you determine any limitations on the domain and range of a relation?
 Lesson Assessment
As you work through each lesson, complete all the questions and learning activities in your binder using paper and pencil, clearly labeling your work (they refer to this as your course folder). These include the Are you Ready, Try This, Share and Self Check questions. Check your work if answers are provided. Remember that these questions provide you with the practice and feedback that you need to successfully complete this course.
Once you have completed all of the learning activities, take the Lesson Quiz. This is the assessment for each lesson and is located under the Assess tab or by using the Quizzes link under the Activities block.
** Note – Share questions may have to be done on your own depending on your learning situation**
Module 4: General Relations
Launch
This section checks to see if you have the prerequisite knowledge and skills to be able to complete this lesson successfully.
Are You Ready?
Complete these questions in your course folder (binder). If you are experiencing difficulty, you may want to use the information and the multimedia in the Refresher section to clarify concepts before completing these exercises.
Print ( or copy by hand) and complete.
Once you have completed these exercises to the best of your ability, use the provided answer link to check your work.
Answers
If you feel comfortable with the concepts covered in the questions, move forward to Discover. If you experienced difficulties or want more practice, use the resources in Refresher to review these important concepts before continuing through the lesson or contact your teacher.
 Refresher
The purpose of this section is to provide you with some resources to review to prepare for the lesson ahead. These resources may include videos, interactive applets, mini-lessons, and flash games to help you recall previously learned concepts. You can use these resources either before or after you try the questions in Are You Ready? Your teacher may also direct you to this section to review specific concepts.
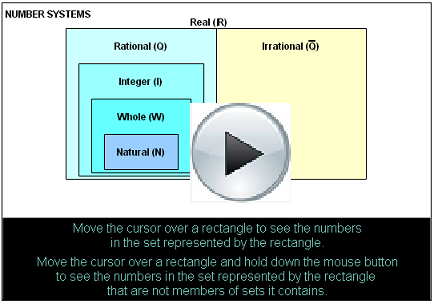
The real number system is made up of rational numbers and irrational numbers.
For more review, go to the “Real Numbers” definition page and try the demonstration applet at the bottom the page. (Use username LA53 and password 4487 if needed).
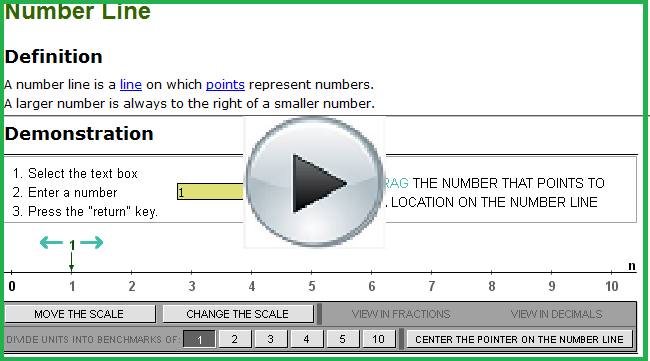
Use the demonstration applet “Number Line” to review the basics of a number line. See if you can use the applet to insert fractions and decimals as well as integers—both positive and negative—on the number line.
Discover
 Try This 1 - 12
Print (or copy by hand) and complete the following Activity in your Course Folder (binder). DO all of the questions before accessing the provided answers below.
Use the link below to check your answers to Try This 1 -12.
Mathematics 10C Learn EveryWare © 2010 Alberta Education
Module 4: General Relations
Explore

© Eureka/Alamy
A tennis ball cannon is an invaluable tool that can help tennis players improve their groundstrokes, smashes, and slices. The machine is pre-loaded with up to 200 tennis balls. The cannon then shoots the tennis balls toward the player at a constant rate. The speed and trajectory of the ball as it comes out of the cannon can be programmed by the player. A few seconds later, another ball is shot out of the cannon to enable the tennis player to continue practising without having to retrieve the ball after each stroke.
In mathematics, a relation is similar to a machine such as the tennis ball cannon. Relations are rules that associate input values to output values. Just as the tennis machine can take a ball and give it speed and height, so can a relation convert input values into output values. You will focus on learning different ways to express the input and output values. You will also apply these principles to graphing.
Glossary Terms
Add the following terms to your "Glossary terms". You may also want to add examples that demonstrate how each term is applied.
-
continuous data
-
discrete data
-
domain
-
interval notation
-
range
-
relation
-
set notation
------------------------------------------------------------------
 Watch and Listen
You can begin this lesson by watching the “Relations” video to gain an overview of what relations are and how you can describe the properties of relations. As you watch, count the number of ways that you can represent relations. To watch the video, use the link below: **Scroll down to find the video**

A relation is a rule that relates the elements of one set of values to the elements of a second set of values. You can think of a relation as a set of ordered pairs, although there are many other ways of representing a relation. You can represent a relation as a table, an arrow diagram or mapping, or a graph. The following example will show several ways to represent the relation from the Discover section.
Example
Recall your work in TT 1 to TT 6 from the Discover section. Show how you can represent the relation in your answers in the following ways:
-
table of values
-
arrow diagram or mapping
-
ordered pairs
-
graph
Solution
Table of Values
In TT 1 you were asked to complete a table relating the figure number to the number of tiles in the border of a design. Your completed table is one way to represent a relation.
The numbers in the first column are related to the numbers in the second column.
Arrow (or Mapping) Diagram
An arrow diagram, or mapping, is similar to a table but has arrows pointing from each input value to the corresponding output value.
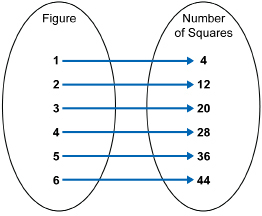
Ordered Pairs
A relation can be expressed as a set of ordered pairs of the form (input, output). In this case, the set is {(1, 4), (2, 12), (3, 20), (4, 28), (5, 36), (6, 44)}. The first coordinates are the numbers from the first column ( input) and the second numbers are the coordinates from the second column ( output).
Graph
The graph that you constructed in the Discover section is yet another way to represent a relation.
You may want to print and use one of either Representing Relations Template 1 or Representing Relations Template 2 to organize your information.
Discrete vs Continuous Data
The graph of a relation can be either discrete or continuous.
Where the values between graphed points have meaning in the context of the question, the data is continuous. In this case, it would be appropriate to join the points with a line or a smooth curve. For example, if you constructed a graph relating the height of a growing plant over time, you would get a continuous graph. This is because all values of both height and time are meaningful. It is possible to have a height of 10 cm, 11 cm, and all values between 10 cm and 11 cm.
On the other hand, where the values between points have no meaning in the question’s context, the data is discrete. It is not appropriate to join the points on a discrete graph. Discrete data include those data you can count. For example, if you graphed the number of people in a store over a period of a business day, you would get a discrete graph. This is because not all real values are meaningful in this context. While it is possible to have 10, 11, or 12 people in the store, you cannot have 10.5 or 11.777 people in the store!
 Tip
Tip
A simple way to identify a situation as being discrete or continuous is to ask yourself whether or not the independent and dependent variables can have values that are between whole numbers, such as 6.25.
For example, a distance-time graph would be an example of a continuous graph since both distance and time can have values between whole numbers. It is possible to have a time value of 6.25 seconds or 6.25 years, and it is also possible to have a distance value of 6.25 m or 6.25 yd.
On the other hand, a graph showing the number of cars sold per year is discrete since you cannot sell 6.25 cars.
 Try This 13
Retrieve Try This 1 - 12 from the Discover section of this lesson.
TT13: Compare the two graphs you created in TT3 and TT8, and decide which one is discrete and which one is continuous. Be sure to provide support for your answer (do this right on the Try This 1 - 12 pages your printed). If necessary, modify your original response based on this new knowledge.
Watch and Listen
Watch “Discrete Data and Continuous Data” see examples of graphs of both continuous and discrete data.

Try This 14
Complete the following in your course folder ( binder), showing all work. Practice graphing data and identifying whether the graph depicts discrete or continuous data. The work may be descriptive or mathematical. You may want to review relevant parts of the lesson as you work through the problems.
Foundations and Pre-calculus Mathematics 10 (Pearson)
TT 14. Complete “Exercises” questions 10 and 11 on page 295 and question 21.a) on page 297.
Use the link below to check your answers to Try This 14.
Possible TT14 (Try This 14) Solutions
Explore 2
Domain and Range
In Lesson 1 you learned about independent and dependent variables. The set of all possible values of the independent variable in a relation is called the domain of the relation. These numbers would include those in the first column of a table, the first elements of a set of ordered pairs, and the x-coordinates of all points on a graph.
On the other hand, the set of all values of the dependent variable of a relation is called the range of the relation. These numbers include those in the second group of an arrow diagram, the second elements of a set of ordered pairs, and the y-coordinates of all points on a graph.
The domain and range are used to describe relations. Knowing the domain and range of a graph can help you to understand the limits of the relation. For example, you can know how high and how low a graph extends as well as how far left and right it extends. In some cases, a graph—such as a line—may extend infinitely in a particular direction. The domain or range can be used to describe this property.
The domain and range of a relation can be described in a number of different ways. These include the following:
-
list
-
words
-
number line
-
set notation
-
interval notation
Each of these different ways will be described in more detail.
List
The elements of the domain and range are listed. If an element of the domain or range appears more than once in the relation, the element is only listed once. It is typical to see the elements listed in ascending numerical order.
Ex 1
For the relation {(1, 4), (2, 12), (3, 20), (4, 28), (5, 36), (6, 44)}, the domain is (1, 2, 3, 4, 5, 6). The range is (4, 12, 20, 28, 36, 44).
Words
The domain and range are stated or written with words. Words are used when it is not efficient to list the elements.
Ex 2
The domain or range of a relation could be stated as “the set of all real numbers.” In other words, any real number is a possible value of the independent variable.
The domain or range of a relation could be expressed as “the set of all real numbers greater than ten.” In this case, only the real numbers greater than 10 are possible values of the dependent variable.
Number Line
You have used number lines in previous math courses to graph inequalities. You can also use number lines to report the domain and range of a relation.
Ex 3
To report the domain “the set of all real numbers greater than or equal to zero,” you could use the following number line.![]()
Similarly, to report the range as “the set of all numbers between 1 and 5, not including 1 and 5,” you could use the following number line.
![]()
Set Notation
Set notation is a formal way of stating the domain and range. In set notation, you give a generic name to the set of numbers. Usually a lowercase letter is used; x is a perennial favourite, but other letters are also used.
When using set notation, remember the following symbols:
-
such that: |
-
consists of, is an element of: ε
-
is less than: <
-
is greater than: >
-
is less than or equal to: ≤
-
is greater than or equal to: ≥
-
equals: =
Ex 4

Interval Notation
Interval notation is primarily used to express the domain or range consisting of all of the real numbers between two points. The use of different styles of brackets indicates whether those points are included or excluded from the domain or range. Note that infinity is not a known quantity, so we always use a round bracket next to it.
Ex 5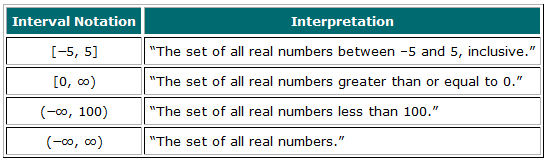
 Read
Read
Go to your textbook to read through some examples that demonstrate how the domain and range of a relation can be determined. Pay particular attention to when the use of a list to report domain and range is appropriate, and when it is not appropriate.
Foundations and Pre-calculus Mathematics 10 (Pearson)Read the following examples:
Note: You will see the use of the word function in your textbook. A function is a special type of relation. You can think of a function as a relation in these examples. You will learn more about functions in Lesson 3. |
 Self Check
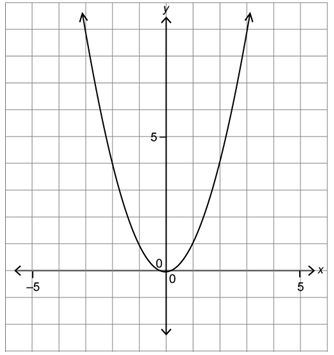
The following is the graph of a relation with equation y = x2. Express the domain and range of the graph.
 Watch and Listen
Watch 'Domain and Range of Relations' on a graph to practice finding domain and range. Note he writes his answers in set notation but is not careful about the formatting we like.
 Try This 15
Complete the following in your course folder ( binder), showing all work.
Go to your textbook now to practise applying the concepts that you have learned. Show work to support your answers. The work may be descriptive or mathematical.
TT 15. Complete “Exercises” questions 4, 7, 9, 19, and 21.b) on pages 294 to 297.
Use the link below to check your answers to Try This 15.
Possible Try This 15 (TT15) Solutions
Mathematics 10C Learn EveryWare © 2010 Alberta Education
Module 4: General Relations
Connect
![]() Lesson Assessment
Lesson Assessment
Complete the lesson quiz posted under the Assess tab or by using the Quizzes link under the Activities block. Also, ensure your work in your binder (course folder) is complete.
 Project Connection **NOT ASSIGNED**
You have examined the domain and range of relations in several different ways. Now go to the Unit 3 Project, and complete the Module 4: Lesson 2 component.
 Going Beyond
Create a rule that relates any numerical input value to a corresponding output value.
Represent your relation in one of the following forms:
-
table of values
-
arrow diagram
-
a set of ordered pairs
-
graph
Share your representation with a friend, and challenge him or her to discover the rule.
Module 4: General Relations
Lesson 2 Summary
In this lesson you investigated the following questions:
-
Why is it appropriate to connect the points on some graphs but not others?
-
How can you determine the limitations on the domain and range of a relation?
In this lesson you learned that a relation is a rule that relates one quantity to another. You learned that relations can be represented in several different ways, including a set of ordered pairs, a table, an arrow diagram, and a graph. Together with a partner, you also brainstormed other methods of representing relations.
You learned that where the values between graphed data points have meaning in the context of the question, the data is continuous and it is appropriate to join the points with a line or a smooth curve. By contrast, where the values between points have no meaning in the context of the question, the data is discrete and it is not appropriate to join the points.
In this lesson you also learned how to express the domain and range of discrete and continuous graphs. Just as there are several ways of representing relations, there are also many ways of expressing the domain and range of a relation. The restrictions on the domain and range can be stated using inequality symbols, or endpoints on a number line, and different styles of brackets. Another way to express domain and range is to restrict the number set to integers only.
To express the domain and range, you could use five different methods.
|
Method |
Explanation |
|
Words |
The domain is all real numbers. The range is all real numbers greater than or equal to 0. |
|
Number Line |
This is the domain.
This is the range.
|
|
Interval Notation |
This is the domain: (−∞, ∞). This is the range: [0, ∞). |
|
Set Notation |
This is the domain: {x| −∞ ≤ x ≤ ∞, x ε R} or {x| x ε R}. This is the range: {y| 0 ≤ y ≤ ∞, y ε R} or {y| y ≥ 0, y ε R}. |
|
List |
This is continuous data, not discrete. So for this example, a list does not make sense as a way to express the domain and range. |
In Lesson 3 you will study functions—a special type of relation. You will learn the difference between functions and non-functions. You will also discover a neat visual technique for identifying graphs that are functions!