Lesson 3: Functions
| Site: | MoodleHUB.ca 🍁 |
| Course: | Mathematics 10C |
| Book: | Lesson 3: Functions |
| Printed by: | Guest user |
| Date: | Friday, 19 December 2025, 3:27 AM |
Module 4: General Relations
Lesson 3: Functions
Focus

© fotum/shutterstock
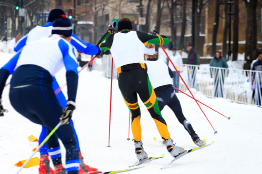
Fitness and medical experts agree that cross-country skiing is one of the most aerobically complete activities. Because no single muscle group is overstressed when someone is cross-country skiing, the activity can be sustained for hours. Also, most cross-country trails have flat, uphill, and downhill sections, which provide natural opportunities for exertion and recovery periods.
When you work your body harder than usual, your heart and other body functions need to keep up with the pace. Keeping your heart pumping at an elevated rate for an extended period of time improves your heart’s capacity to pump blood efficiently and effectively. However, to get an optimum workout, it is important to pace your exercise. Too low a heart rate does not provide any substantial health benefits. Too high a heart rate can be dangerous to your health. You want your heart rate at the proper intensity level for an extended period of time.
That is why one of the most effective methods for fitness training is through monitoring and controlling your speed and heart rate. Later in this lesson, you will explore the relationship between speed and heart rate to discover if it is a special kind of relation called a function.
Outcomes
At the end of this lesson, you will be able to
-
explain, using examples, why some relations are not functions but all functions are relations
-
determine whether a set of ordered pairs represents a function
-
sort a set of graphs as functions or non-functions
-
generalize and explain rules for determining whether graphs and sets of ordered pairs represent functions
Lesson Questions
-
Why is it that some relations are not functions?
-
How can you tell if a relation is a function?
 Lesson Completion and Assessment
As you work through each lesson, complete all the questions and learning activities in your binder using paper and pencil, clearly labeling your work (they refer to this as your course folder). These include the Are you Ready, Try This, Share and Self Check questions. Check your work if answers are provided. Remember that these questions provide you with the practice and feedback that you need to successfully complete this course.
Once you have completed all of the learning activities, take the Lesson Quiz. This is the assessment for each lesson and is located under the Assess tab or by using the Quizzes link under the Activities block.
** Note – Share questions may have to be done on your own depending on your learning situation**
Module 4: General Relations
Launch
This section checks to see if you have the prerequisite knowledge and skills to be able to complete this lesson successfully. Before you begin working with functions, it is important that you have a good understanding of relations.
Are You Ready?
Complete these questions in your course folder (binder). If you are experiencing difficulty, you may want to use the information and the multimedia in the Refresher section to clarify concepts before completing these exercises.
Print and Complete
Once you have completed these exercises to the best of your ability, use the provided answer link to check your work.
Answers
If you feel comfortable with the concepts covered in the questions, move forward to Discover. If you experienced difficulties or want more practice, use the resources in Refresher to review these important concepts before continuing through the lesson or contact your teacher.
 Refresher
The purpose of this section is to provide you with some resources to review in preparation for the lesson ahead. These resources may include videos, interactive applets, mini-lessons, and flash games to help you recall previously learned concepts. You can use these resources either before or after you try the questions in Are You Ready? Your teacher may also direct you to this section to review specific concepts.
For review, watch the video titled “Graphic Representations,” which shows an example of how you can interpret the independent and dependent variables in a given context. **Scroll down to find the video**

You may also want to review the first part of the Explore section in Lesson 2 to review how to identify dependent and independent variables.
A relation is a set of ordered pairs. The domain of a relation consists of all values of the independent variable. The range of a relation consists of all values of the dependent variable.
Watch 'Domain and Range of Relations' on a graph to practice finding domain and range. Note he writes his answers in set notation but is not careful about the formatting we like.

Module 4: General Relations
Discover
In this lesson you will learn how to tell the difference between relations that are functions and relations that are not functions. You will learn a formal definition of functions later in the lesson. In this section you will see if you can discover what defines a relation as a function.
 Math Lab: Identifying Functions
Go Math Lab: Identifying Functions, print it and complete it.
Math Lab: Identifying Functions
Once you have completed these questions, use the link below to check your answers. Make any corrections or notes as needed. File this in your binder( course folder).
Module 4: General Relations
Explore

© 2010 Alberta Education and its licensors. All rights reserved.
Did you know that the International Olympic Committee (IOC) recognizes 15 different disciplines in the Winter Olympics? Each discipline is comprised of several events. For example, figure skating has four events: men’s singles, ladies’ singles, pairs, and ice dance. Another example is the biathlon, which combines the disciplines of cross-country skiing and rifle shooting. At the 2010 Winter Olympics in Vancouver, the biathlon consisted of ten events. These events include individual, relay, sprint, and pursuit events in each the men’s division and the women’s division. While all of these events involve cross-country skiing and rifle shooting, only some are considered individual events, while other are considered team events.
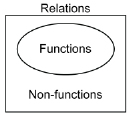
In this lesson you will learn about a special type of relation called a function. Functions are to relations what the individual events in biathlon are to the Olympic sport of biathlon. In other words, functions are a subset of relations.
Glossary Terms
Add the term function to your Glossary Terms section in your notes.
----------------------------------------------------------------------------------
Recall that relations are rules that connect one value to another. Relations can be described as ordered pairs in which the first value is the input and the second value is the output.
|
|

![]() Try This 1
Try This 1
Retrieve the results of the Math Lab that you completed in the Discover section. Now that you have the definition of a function, complete the following.
TT 1. a. Go back to your responses to the Analysis questions in Math Lab: Identifying Functions, and record reasons why each representation of the non-functions is not a function.
b. Record reasons why the functions sets are functions.
Possible TT1 (Try This 1) Solutions
 Read
Read
Read the next example to see how you can identify an arrow diagram as a function and a non-function.
Example 1
The Staal family from Thunder Bay, Ontario, is a famous hockey family. Henry and Linda Staal are the parents of sons Eric, Jordan, Marc, and Jared. Three of the four sons play professional hockey in the National Hockey League. The youngest, Jared, has been drafted and is taking steps to realize his dream of playing in the NHL.
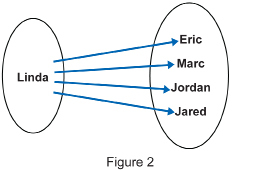
Consider the two arrow diagrams representing the relationships in this family. (Note: The input is the name or names on the left-hand circle. The output is the name or names in the right-hand circle.)
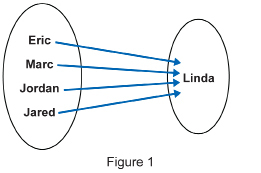
- a. How is the input related to the output in Figure 1?
b. How is the input related to the output in Figure 2? - Which arrow diagram fits the definition of a function? Why?
Solution
- a. In Figure 1, each name on the left represents the son of the name of the person on the right.
- Eric is the son of Linda.
- Marc is the son of Linda.
- Jordan is the son of Linda.
- Jared is the son of Linda.
- Linda is the mother of Eric.
- Linda is the mother of Marc.
- Linda is the mother of Jordan.
- Linda is the mother of Jared.
- The arrow diagram in Figure 1 conforms to the definition of a function because each input value only has one output value. In this case, each son only has one mother. In Figure 2, the input value is associated with more than one output value. That is, Linda’s son is Eric and Marc and Jordan and Jared. This is still a relation, but it does not fit the definition of a function.
Retrieve the results of the Math Lab you completed in the Discover section. You analyzed some relations represented by graphs, ordered pairs, and arrow diagrams. You formed a hypothesis about how to separate functions from non-functions.
Now that you know what the definition of a function is, you can check your answers. The following example will revisit the three questions posed at the end of the Discover section, using different examples.
Example 2
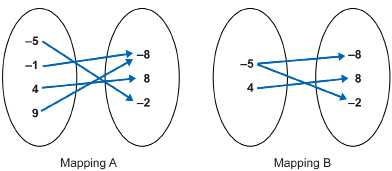
For each pair of relations, decide which one is a function and which one is not a function. Explain your reasoning.
Solution 2
- A function has only one output value for each input value.
In Mapping A, there is only one arrow leading out of each of the input values -5, -1, 4, and 9. (Even though there are two arrows arriving at the output value of -8, this does not contradict the definition of a function.) Therefore, Mapping A shows a relation that is a function.
In Mapping B, there are two arrows leading out of the input value -5. This relation is not a function. Notice that even though there is only one arrow arriving at each of the output values -8, 8, and -2, this does not matter when identifying functions. - In Set A, the domain value of 2 is associated with two range values: 9 and -1. Therefore, Set A does not represent a function.
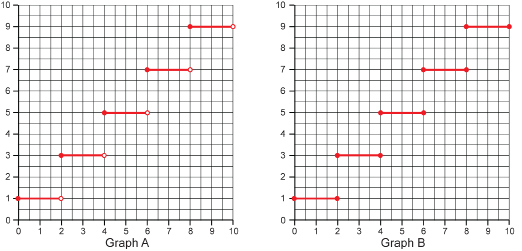
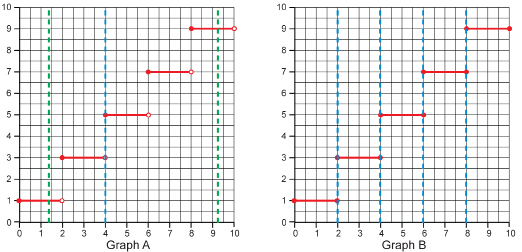
In Set B, each domain value is associated with only one range value. Therefore, Set B is a function. - The graph of a function will not have any pair of points with the same x-coordinate. A test called the vertical line test can be used to quickly determine whether this is the case for a particular graph. Put a pencil or a ruler on your graph vertically. Keeping your pencil or ruler vertical, move it across the graph from left to right. If the vertical line simultaneously intersects the graph in two more points during any part of the movement or sweep, then the graph fails the test and is not a function. Otherwise, it is a function.
Graph A passes the vertical line test since no two points line up along a vertical line. The following diagram shows several vertical lines drawn on the graph. The blue line seems to pass through two points, (4, 3) and (4, 5), but it does not. Since one of the points is open, it is not part of the graph. Therefore, there is only one value of the range associated with that value of the domain, namely (4, 5).
Graph B fails the vertical line test in several places as shown in the diagram. In these places, there are two range values associated with the domain values 2, 4, 6, and 8.
 Watch and Listen
View the “Vertical Line Test Demonstration” to see how the vertical line test is applied to both discrete and continuous graphs. See if you can determine whether each graph passes or fails the test before the line completes its sweep across the screen. Username is LA53 password is 4487.
---------------------------------
Here is another site that compares Relations and Functions.
|
|
 Read
Read
Go to your textbook to study more examples of identifying functions. At the end of this section, you will be asked to describe your personal strategies for identifying functions based on how the relation is represented. As you work through the examples, you may want to write down some notes to help you remember your own strategies.
Foundations and Pre-calculus Mathematics 10 (Pearson)
First, read “Example 1: Identifying Functions” on pages 266 and 267. Then, turn to “Example 1: Identifying Whether a Graph Represents a Function” on page 290.
 Try This 2
Complete the following in your course folder ( binder).
Foundations and Pre-calculus Mathematics 10 (Pearson)
TT2: a. Complete “Exercises” questions 4, 8, and 12 on pages 270 to 272.
b. Complete “Exercises” questions 5, 6, and 8 on page 294.
Use the link below to check your answers to Try This 2.
Possible TT2 (Try This 2) Solutions
Module 4: General Relations
Connect
 Lesson Assessment
Complete the lesson quiz posted under the Assess tab or by using the Quizzes link under the Activities block. Also, ensure your work in your binder (course folder) is complete.
Project Connection ** NOT ASSIGNED**
© Suzanne Tucker/shutterstock
In the Focus section of this lesson, you read about the relationship between speed and heart rate in cross-country skiing. Following is a graph that illustrates this relation.
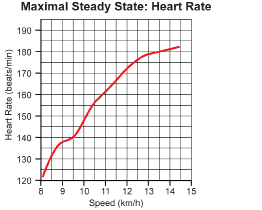
Is this relation of speed to heart rate a function? Why or why not?
Your heart rate is the number of times your heart beats in one minute.
One way to measure your heart rate is to take your pulse. The two most common spots used to measure your own pulse are the artery on the thumb side of your wrist and the artery on the side of your neck.
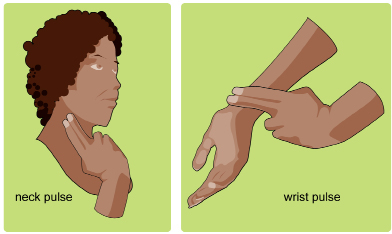
To take your pulse, touch the artery lightly until you feel your pulse. Count the number of heart beats for 15 seconds. The heart rate is the number of times a person’s heart beats in one minute, so multiply by four to find your heart rate.
You may wish to practise a couple of times. Once you are confident that you can find your pulse, go to the Unit 3 Project to complete the Module 4: Lesson 3 component.
Module 4: General Relations
 Going Beyond

© photobar/shutterstock

© Paul Banton/shutterstock
Functions can be used to predict future events. The following is an example.
The cheetah is a member of the cat family known for its speed. In fact, the cheetah can accelerate from rest to 96 km/h in 3 s! Cheetahs are carnivores, known to stalk hoofed animals such as the Thomson’s gazelle. The gazelle, also a swift animal, can run as fast as 80 km/h.
A cheetah is stalking a gazelle in the Serengeti Grasslands. The cheetah has approached the gazelle to within a distance of 70 m.
Suddenly, the gazelle senses trouble and starts to bolt. The cheetah instantly gives chase! After 5 seconds, assume that both the cheetah and gazelle are running at their maximum speed. You can use a graph (with labelled axes and a title) to figure out whether the cheetah will be able to catch the gazelle.
|
Cheetah |
Gazelle |
||
|
t (s) |
d (m) |
t (s) |
d (m) |
|
5.0 |
93.3 |
5.0 |
126.3 |
|
6.0 |
120.0 |
6.0 |
148.5 |
|
7.0 |
146.7 |
7.0 |
170.7 |
|
8.0 |
173.3 |
8.0 |
192.9 |
|
9.0 |
200.0 |
9.0 |
215.1 |
|
10.0 |
226.7 |
10.0 |
237.3 |

- What do the data table and the graph tell you?
- Will the cheetah’s hunt be successful this time? If so, how long will the hunt take?
Module 4: General Relations
Lesson 3 Summary
In this lesson you investigated the following questions:
-
Why is it that some relations are not functions?
-
How can you tell if a relation is a function?
In this lesson you learned that a function is a special type of relation. Each input value of a function has only one output value. The important idea is not that the output value is unique, but that there is only one output value. Some relations conform to this rule and are called functions. Other relations can only be described as relations, not functions. You studied an example relating four sons and their mother. Since each son only has one mother, the son-mother relationship is analogous to a function. On the other hand, since the mother has four sons, the mother-son relationship is not analogous to a function, since the input (mother) has more than one output (four sons). Despite this, all functions are considered relations since they can be expressed as a set of ordered pairs.
Besides learning the difference between a relation and a function, you also learned how to tell if relations, expressed in a variety of ways, are functions. You developed personal strategies for identifying functions and non-functions. The vertical line test is an example of such a strategy for testing relations expressed as graphs. If the vertical line intersects the graph in more than one point at a time, then the graph fails the test and is not a function.
In the remaining lessons in this module you will investigate the slope of a line. You will learn how to use the slope to interpret the rate of change of one variable compared to another variable. You will also learn how to use slope to predict values on graphs.