Lesson 2: Properties of Linear Functions
| Site: | MoodleHUB.ca 🍁 |
| Course: | Mathematics 10C |
| Book: | Lesson 2: Properties of Linear Functions |
| Printed by: | Guest user |
| Date: | Tuesday, 4 November 2025, 3:35 AM |
Module 5: Linear Functions
Lesson 2: Properties of Linear Functions
Focus

© Outsider/shutterstock
A calorie is a unit of food energy. A meal consisting of a hamburger, a milkshake, and a large order of French fries will contain more calories than a meal consisting of a salad and a glass of water. In addition to providing energy for the function, growth, and development of cells that make up the human body, the energy provided by the calories in food is also used to support physical exercise.
Elite athletes are careful to balance their intake of calories and amount of exercise. In times of intense training, an athlete may consume more calories because she knows that she will need the extra energy. An Olympic boxer or wrestler may want to lose weight or gain weight just prior to a bout in order to compete in a particular weight class. The athlete can gain or lose weight by adjusting calorie intake and the exercise regimen.
If the intensity of the exercise is constant, then a linear relationship exists between the amount of energy expended and the duration of exercise. In the previous lesson you learned to identify linear relations from graphs, tables, and situations, to name a few instances. In a previous module you also learned how to identify a relation as a function.
In Lesson 2 you will study the properties of linear functions. These properties include slope and intercepts.
Outcomes
At the end of this lesson, you will be able to
-
determine the intercepts of the graph of a linear relation, and state the intercepts as values or ordered pairs
-
determine the slope of the graph of linear relations
-
determine the domain and range of the graph of a linear relation
-
sketch a linear relation that has one intercept, two intercepts, or an infinite number of intercepts
Lesson Questions
-
How are linear functions uniquely defined by their properties?
-
How can the properties of linear functions be used to solve problems?
 Lesson Completion and Assessment
As you work through each lesson, complete all the questions and learning activities in your binder using paper and pencil, clearly labeling your work (they refer to this as your course folder). These include the Are you Ready, Try This, Share and Self Check questions. Check your work if answers are provided. Remember that these questions provide you with the practice and feedback that you need to successfully complete this course.
Once you have completed all of the learning activities, take the Lesson Quiz. This is the assessment for each lesson and is located under the Activities block on the left in moodle or under the Assess tab.
** Note – Share questions may have to be done on your own depending on your learning situation**
Module 5: Linear Functions
Launch
This section checks to see if you have the prerequisite knowledge and skills to be able to complete this lesson successfully.
Are You Ready?
Complete these questions in your course folder binder. If you are experiencing difficulty, you may want to use the information and the multimedia in the Refresher section to clarify concepts before completing these exercises.
Once you have completed these exercises to the best of your ability, use the provided answer link to check your work.
Answers
If you feel comfortable with the concepts covered in the questions, move forward to Discover. If you experienced difficulties or want more practice, use the resources in Refresher to review these important concepts before continuing through the lesson or contact your teacher.
 Refresher
The purpose of this section is to provide you with some resources to review in preparation for the lesson ahead. These resources may include videos, interactive applets, mini-lessons, and flash games to help you recall previously learned concepts. You can use these resources either before or after you try the questions in Are You Ready? Your teacher may also direct you to this section to review specific concepts.
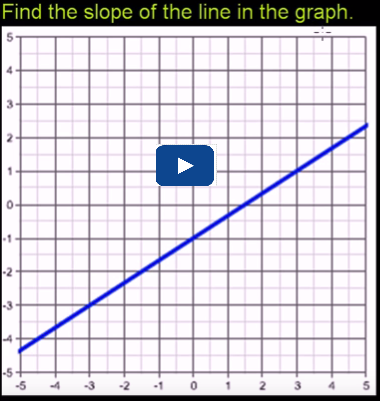
For a review on finding the Slope of a Line, go to the video below (click on the picture) to see how you can use points to determine the rise and run of a line and thus the slope of a line.
The domain of a relation consists of all values of the independent variable. The range of a relation consists of all values of the dependent variable.
For a review on finding the Domain and Range, go the video below (click on the picture) to see a demonstration of finding domain and range from a graph.

Discover
 Math Lab: Investigating Intercepts
Go Math Lab: Investigating Intercepts, print it (or copy by hand) and complete it.
Math Lab: Investigating Intercepts
Once you have completed these questions, use the link below to check your answers. Make any corrections or notes as needed. File this in your binder( course folder).
Mathematics 10C Learn EveryWare © 2010 Alberta Education
Module 5: Linear Functions
Explore

© jon11/8024049/Fotolia
The triathlon is a challenging sport that combines three races into one: swimming, cycling, and running. The triathlon debuted at the 2000 Summer Olympics in Sydney, Australia. The race is grueling, and an athlete needs to be well conditioned in order to perform at the highest levels. The competitor with the fastest combined speed wins the event.
The progress of an athlete through a particular phase of a triathlon can be represented by a distance-time graph. This graph could be closely approximated by a linear function.
Glossary Terms
Add the following terms to your Glossary Terms" section in your notes, including definitions and examples as needed.
- linear function
- x-intercept
- y-intercept
----------------------------------------------------------------------------------------------------------------
A GRAPH OF A LINEAR FUNCTION
The graph of a linear function can be described by its properties. These properties include slope, intercepts, domain, and range. As you have seen from the linear functions you have sketched or graphed, their location on the coordinate plane and slope make each function unique.
The intercepts of any relation are the points where the graph of the relation crosses the x-axis or the y-axis. Where a graph crosses the x-axis, the point of intersection is called the x-intercept. Likewise, where a graph crosses the y-axis, the point of intersection is called the y-intercept.
![]() Try This 1 - 4
Try This 1 - 4
Print (or complete by hand) and complete the following in your course folder binder.
Use the link below to check your answers to Try This 1 - 4.
![]() Share 1 - 7
Share 1 - 7
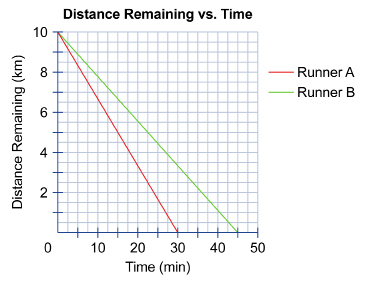
Study the following distance-time graph showing the progress of two non-Olympic athletes through the 10-km running portion of a triathlon.
Complete these questions in your course folder (binder) and use the link provided to check your work.
1. How is this graph different from other distance-time graphs you have seen previously?
2. Who is the faster runner? How do you know?
3. After 15 minutes, how much farther does each runner have to run in order to complete the race?
4. How is the graph for Runner A similar to the graph for Runner B?
5. Express the y-intercept of each graph as an ordered pair. What is the meaning of each element of the ordered pair in this context?
6. Express the x-intercept of each graph as an ordered pair. What is the meaning of each element of the ordered pair in this context?
7. a. Is it possible to sketch a different line with the same slope as the red line?
b. Is it possible to sketch a different line with the same intercepts as the red line?
----------------------------------------------------------------------
You may have learned in the Discover section that a linear relation can have one, two, or infinitely many intercepts.
Compare the following examples with your own sketches. Some of the examples may be identical to your own graphs, whereas others may not be identical. As you study the examples, see if you can determine for which ones there must be only one way to sketch the graph.
Example
Sketch two graphs for each of the following conditions.
-
two intercepts
-
one intercept only
-
infinitely many intercepts
In each case, state the intercepts as ordered pairs.
Solution
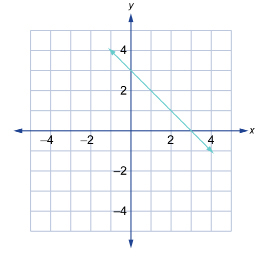
-
Graphs with two intercepts.
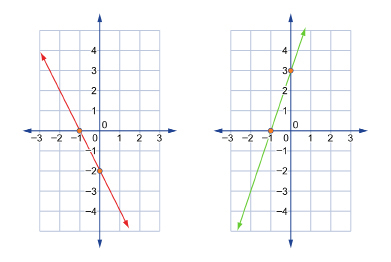
The red line on the graph to the left passes through x-intercept (-1, 0) and y-intercept (0, −2)
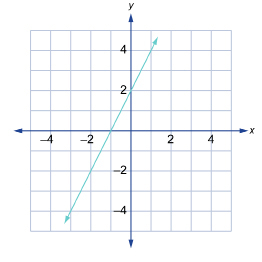
The green line on the graph to the right also passes through x-intercept (-1, 0) but passes through a different y-intercept of (0, 3). - Graphs with only one intercept.

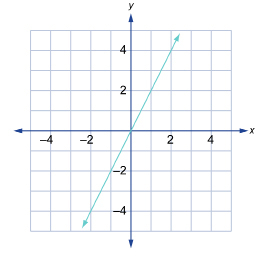
The red horizontal line passes through the y-intercept of (0, 3), and the green vertical line passes through the x-intercept (0, −1). - Graphs with infinitely many intercepts.
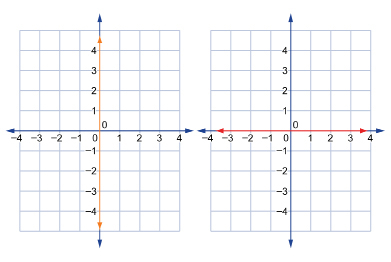
Since the vertical line graphed on the left is also the y-axis, the graph has infinitely many y-intercepts. In other words, every point along the y-axis is a y-intercept of this line.
Since the horizontal line graphed on the right is also the x-axis, the graph has infinitely many x-intercepts. In other words, every point along the x-axis is an x-intercept of this line.
Did You Know?
You can state the intercepts of graphs as values, as well as ordered pairs. For example, the y-intercept (0, 3) can also be stated as y-intercept = 3. Similarly, the x-intercept (2, 0) can also be stated as x-intercept = 2. In both cases, it is understood that the coordinate that is not stated is 0.
![]() Self-Check
Self-Check
SC 1. For each of the following graphs, write the x- and the y-intercepts in the form of an ordered pair. Assume that the scale along each axis is 1 unit.
Module 5: Linear Functions
Recall the concepts of domain and range you learned in Module 4. Recall that the domain is the list of all values of the independent variable and that the range is the list of all values of the dependent variable. The following Share exercise will help you understand the domain and range of linear relations.
 Share 8 - 12
Print (or complete by hand) Share 8 - 12 and work with a partner ( if possible) to complete them.
Share 8 - 12
Now check your work using the link provided.
Possible S8-12 ( Share 8 - 12) Solutions
 Read
Read
In previous lessons you learned about the slope of a linear relation.You learned in this lesson about a linear relation’s intercepts, domain, and range. These concepts are meaningful in real-world situations.
Work through the following examples to see how to interpret the graph of a linear relation in specific contexts. Pay particular attention to instances where the domain and range of a linear function are restricted. Try to see if you can discover the reason for each restriction.
Foundations and Pre-calculus Mathematics 10 (Pearson)Read “Example 1: Determining Intercepts, Domain, and Range of the Graph of a Linear Function” on page 314. |
 Self-Check 2 - 4
See how well you know the properties of linear functions by completing the following questions.
A long distance phone company charges a recurring fee of $12/month and $0.10 per minute on long distance phone calls. The total bill for the month can be represented by the equation C = 0.10n + 12, where C represents the total cost of the bill and n represents the number of minutes tallied for that month.
SC 2. Sketch the graph of the equation.
SC 3. Following are two sets of statements that refer to this context.
a. Select the true statement and give reasons to support your answer.
A. The slope represents the number of minutes used.
B. The slope represents the recurring monthly charge.
C. The slope represents the cost per minute.
D. The slope represents the amount of the total bill.
b. Select the true statement and give reasons to support your answer.
A. The y-intercept represents the number of minutes used.
B. The y-intercept represents the recurring monthly charge.
C. The y-intercept represents the cost per minute.
D. The y-intercept represents the amount of the total bill.
SC 4. You are planning a ten-day trip to Brazil. You will be spending $2000 for your flight and $100/night for accommodations. The following graph compares the number of days spent versus the total cost of the trip.
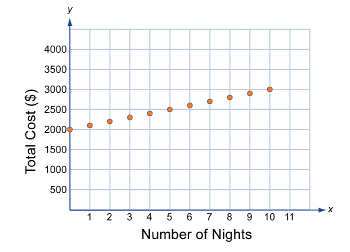
a. State the domain and range of the graph.
b. Indicate how the domain and range are restricted.
 Try This 5
Complete the following questions from your textbook in your course folder ( binder).
Foundations and Pre-calculus Mathematics 10 (Pearson)
TT 5. Complete “Exercises” questions 4, 9, and 16 on pages 319 to 322.
Use the link below to check your answers to Try This 5.
Possible TT5 (Try This 5) Solutions
Mathematics 10C Learn EveryWare © 2010 Alberta Education
Module 5: Linear Functions
Connect![]() Lesson Assessment
Lesson Assessment
Complete the lesson quiz posted under the Quizzes link to the left in moodle or under the Assess tab and ensure your work in your binder (course folder) is complete.
 Project Connection ** NOT ASSIGNED**

Jupiterimages/Brand X Pictures/Thinkstock
In your last lesson you researched and began to analyze linear data. This data may have been related to the Olympics. In this lesson you will use the same data that you already have: a table of values, a graph, or an equation. You will use that information to answer questions.
Go to the Unit 3 Project and complete the Module 5: Lesson 2 component of the project.
 Going Beyond

left: © aberenyi/14545323/Fotolia; right: © William Attard McCarthy/shutterstock
There are many factors to consider when you are planning to buy a new car. These include safety, comfort, style, handling, and fuel consumption. For many people, fuel consumption is one of the most important factors. Graphs of linear functions can be used to assist consumers in their vehicle purchases.
Study the following graph, which compares the fuel consumption of a Smart car to that of a Volvo.
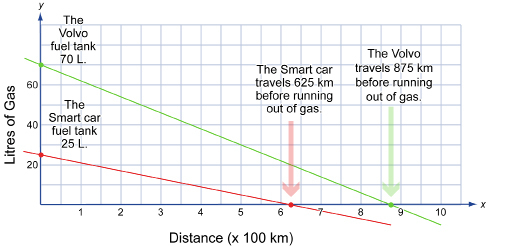
Notice the information you can gain from looking at the intercepts on the graph.
-
What title would you give to this graph?
-
Do you think you could find the equation of the green line (the Volvo) and the red line (the Smart car)?
-
What do you think the slopes of the blue line and the green line represent?
Module 5: Linear Functions
Lesson 2 Summary
In this lesson you investigated these questions:
-
How are linear functions uniquely defined by their properties?
-
How can the properties of linear functions be used to solve problems?
A line is uniquely defined by two points on the line or by a slope and a point. In other words, there is only one possible line that can pass through a particular pair of points. Likewise, while there may be many lines that share a common slope, there is only one line that possesses that slope and also passes through a given point.
In this lesson you studied the properties of linear functions.
You learned about the intercepts of a line and observed that all x-intercepts have the form (x, 0) and that all y-intercepts have the form (0, y). You also learned that a line can have one, two, or infinitely many intercepts.
In this lesson you also examined the domain and range of a linear relation. You learned that both the domain and the range of a diagonal line are always elements of the real numbers. Only in the case of horizontal lines is the range restricted to a single value while the domain remains unrestricted. A vertical line is not a linear function since it fails the vertical line test. However, the range of a vertical line is an element of the real numbers and its domain is limited to a single value.
This lesson reinforces the concept that the slope of a linear function is constant. Whenever you see the graph of a linear function, you will know that the change in the dependent variable is constant relative to the change in the dependent variable. Whether the context refers to an athlete who is running at a steady pace or a car that is consuming gasoline at a constant rate, each situation represents a constant change.
In upcoming lessons you will study the equations of linear relations. You will see that just as different athletes might have different approaches to training, there are different ways of expressing linear relations.