Lesson 1: Solving Linear Systems by Graphing
| Site: | MoodleHUB.ca 🍁 |
| Course: | Mathematics 10C |
| Book: | Lesson 1: Solving Linear Systems by Graphing |
| Printed by: | Guest user |
| Date: | Friday, 19 December 2025, 5:25 AM |
Module 7: Systems of Linear Equations
Lesson 1: Solving Linear Systems by Graphing
Focus

iStockphoto/Thinkstock
Photography is a popular hobby that appeals to many people. There are many reasons to get into photography. Some people enjoy capturing the special moments of their lives shared with family and friends. Others like to use photography as a way to explore their creative side. Whether you are shooting photos of a graduation ceremony or a floral arrangement, you will want a camera that serves your needs and budget.
Suppose you and a friend decide to pool your money to buy a camera together. You have been placed in charge of shopping for the right camera. You know that your friend wants a camera that can take high-quality images and is affordable. At the same time, you want to have a camera that is lightweight and has the ability to record video. When you go to the stores to look at cameras, you must keep these conditions in mind. The camera you purchase should meet all of these conditions.
In this lesson you will be introduced to systems of equations, also known as linear systems. Solving a system of equations is similar to the situation described above. Just as the camera you choose must meet all conditions, the correct solution of a system must satisfy all equations in the system. In this lesson you will learn how to solve a linear system by graphing.
Outcomes
At the end of this lesson, you will be able to
- determine and verify the solution of a system of linear equations graphically, with and without technology
- explain the meaning of the point of intersection of a system of linear equations
Lesson Questions
- What is meant by the solution of a system of equations?
- How is solving a mathematical problem different from verifying a solution to the problem?
 Lesson Completion and Assessment
As you work through each lesson, complete all the questions and learning activities in your binder using paper and pencil, clearly labeling your work (they refer to this as your course folder). These include the Are you Ready, Try This, Share and Self Check questions. Check your work if answers are provided. Remember that these questions provide you with the practice and feedback that you need to successfully complete this course.
Once you have completed all of the learning activities, take the Lesson Quiz. This is the assessment for each lesson and is located under the Activities block on the left in moodle or under the Assess tab.
** Note – Share questions may have to be done on your own depending on your learning situation**
Module 7: Systems of Linear Equations
Launch
Are You Ready?
Complete these questions in your binder. If you are experiencing difficulty, you may want to use the information and the multimedia in the Refresher section to clarify concepts before completing these exercises.
Once you have completed these exercises to the best of your ability, use the provided answer link to check your work.
Answers
If you feel comfortable with the concepts covered in the questions, move forward to Discover. If you experienced difficulties or want more practice, use the resources in Refresher to review these important concepts before continuing through the lesson or contact your teacher.
 Refresher
The purpose of this section is to provide you with some resources to review in preparation for the lesson ahead. These resources may include videos, interactive applets, mini-lessons, and flash games to help you recall previously learned concepts. You can use these resources either before or after you try the questions in Are You Ready? Your teacher may also direct you to this section to review specific concepts.
----------------------------------------
Use the “Graphing Linear Equations Using the Linear Function Explorer” interactive applet to review how the equation of a linear relation in slope-intercept form relates to its graph.

----------------------------------
Watch this video how to "Graph an Equation in Point - Slope form".
--------------------------------
Watch this video to review "How to check if a point is on a line".
Review "Evaluate an Expression" to help evaluate an expression for specific values of its variable.
![]()
----------------------------
Materials
**A hand held graphing calculator is REQUIRED**
You may find it helpful to use the Graph Paper Template to complete some of the questions as you work through the lesson.
Module 7: Systems of Linear Equations
Discover
In this section you will try solving a system of equations. You will begin to explore how you can use graphing to determine the solution to a system of equations. You may notice a relationship between the solution of a linear system and the graph of the system. Later in the lesson, you will revisit your initial discoveries from this section.
 Try This 1 - 7
Complete the following in your binder.
Try This 1 - 7 Questions
Use the link below to check your answers to Try This 1 - 7.
Possible TT1-7 Solutions
In this exercise you should have learned that there are many combinations of x-values and y-values that will satisfy a particular equation. However, you should have also observed that there may be fewer x-values and y-values that satisfy each equation in a system of equations.
You will revisit the principles presented in this Discover section later in the lesson.
Module 7: Systems of Linear Equations
Explore
Study the following two photos. Which one is more interesting to you? Which one do you think conforms to the principles of photography? One of the principles of photography is called the rule of thirds. This rule helps a photographer to compose a picture by aligning the key features of the photo to a 3 × 3 grid. You do this by first dividing the photo into thirds both horizontally and vertically. To make your photo interesting, place the key features of the photo at the points of intersection.

Try this exercise: Print the photos. Use a pencil and a ruler to divide each photo into thirds, along both the width and along the length. Draw grid lines across and down each photo. Do you notice that the lines across the second photo intersect along the face of the man to focus your attention there?
In this lesson you will learn a method for solving linear systems that involves graphing. Just like the rule of thirds in photography, the key to finding correct solutions is found at the points of intersection.
Glossary Terms
Add these terms and their definitions to the Glossary Terms section in your notes. You may also want to add examples that demonstrate how each term is applied.
- linear system/system of equations
- point of intersection
- solution to a system
------------------------------------------------------
 Try This 8 - 10
Complete the following in your binder.
Try This 8 - 10 Questions
Use the link below to check your answers to Try This 8 - 10.
Possible TT 8-10 Solutions

You may have noticed in the Try This exercise that when the game involves the guessing of two numbers, a minimum of two clues are required. Likewise, when the game involves the guessing of three numbers, a minimum of three clues are required.
Solving equations with multiple unknowns is a similar undertaking. When you are solving an equation with two unknown variables, it is not possible to do so with only one equation.
For example, the equation x + y = 10 indicates that the sum of two numbers is 10. The solution, however, could be any number of different pairs including 1 and 9, 2 and 8, or even –3 and 13. More clues are required in order to pinpoint the correct values. If the second clue is the equation x = 7, then you could use the two equations together to determine that x = 7 and y = 3. In this case, the equations x + y = 10 and x = 7 form a system of equations, or a set of clues, to determine the value of the unknown variables.
In general, the number of equations must be equal to or greater than the number of unknowns to be determined.

© Monkey Business/10787552/Fotolia
Imagine that one day you decide that you want to eat lunch at one of the fast-food restaurants near your home. You have several choices including a pizza parlour, a sandwich shop, and a burger joint. You could be satisfied with any of the three choices. The next day, you and a friend get together to have lunch. You are still open to going to any of the three restaurants that you were considering the day before, but your friend has suggested a local deli, a hot dog stand, or the sandwich shop. Where should you go for lunch in order to satisfy both of you?
In the Discover section you may have found that solving a system of equations is similar to the situation described in the above paragraph. There are many solutions to a linear equation. In other words, there are many combinations of x-values and y-values that will satisfy a particular equation. However, there may be fewer solutions to a system of equations or fewer x-values and y-values that satisfy each equation in a linear system.
You have also learned from the Discover activity that you can find the solution to a system of equations by graphing.
You have previously learned different techniques for graphing linear relations. Ensure you know the three different methods by the end of the lesson.
The three different ways to graph a linear relation are:
1. Develop a table of values.
2. Change the equation into slope intercept form.
3. Algebraically find the x and y intercepts.
 Share 1 - 4
Consider the system of equations:
2x + y = 5
x – y = 10
Work with a partner (if possible) to complete Share questions 1 to 4 to solve the system of equations by graphing.
Share 1 - 4 Questions
Use the provided link to check your work.
Possible S1 - 4 Solutions
Work through the next example in your textbook; then make any necessary revisions to the Share questions you just completed.
 Read
Read
Go to the textbook you are using to complete this course to find an example of how to solve a linear system by using a graphing method. Work through the example and pay attention to the strategy used to graph the linear equations in the system and how the solution is verified.
Compare the strategies learned in the example to the one developed in the Share activity. Write down what you feel is important to remember about using the strategies shown in the example.
Foundations and Pre-calculus Mathematics 10 (Pearson)
Read “Example 1: Solving a Linear System by Graphing” on page 405. Is your strategy for graphing the equations the same as that shown in the example?
Module 7: Systems of Linear Equations
 Watch and Listen
To watch a video about "Solving systems of equations".

Watch the video from the beginning to 3:30 to see how you can model a situation with a system of linear equations. The video will also show you how you can solve the system by graphing. As you watch the video, pay attention to how the graph can be used to make decisions related to the original problem.
 Share 5 - 7
Discuss the following questions with a partner ( if possible)
5. Verify the solution to the system of equations in the previous Share activity, according to the example shown in your textbook.
6. When verifying, which values are used? Why are these values placed into the original equations of the linear system?
7. Under what circumstances would it be inefficient to use a graphing method to determine the solution to a system of equations?
Use the provided link to check your work.
Possible S 5 - 7 Solutions
Verifying Solutions
Example 1. For which of these systems is (3, –2) a solution? Do not graph the systems. Use verifying techniques to check each system.
A. x + 2y = -1
2x - y = 4
B. 2x + 3y = 0
x - y = 5
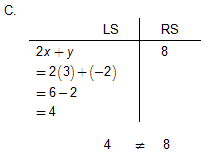
C. 2x + y = 8
3x - 4y = 14
Solution 1. We substitute 3 into each x coordinate, -2 into each y coordinate and then check to ensure both sides come out to be the same number.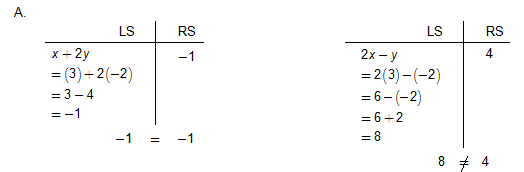
(3, –2) is not the solution to this system because it does not satisfy the second equation in the system.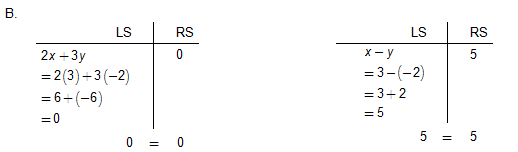
Since both equations are verified, (3, –2) is the solution to this system.
(3, –2) is not the solution to this system because it does not satisfy the second equation in the system.
NOTE: It is necessary to check both equations to make sure the point works in both equations. The exception is if the point does not work in the first equation, we would know that the solution does not work.
Watch and Listen
For an in depth summary of the content in the lesson to date, use the link below. She goes through all the major concepts.
"Solving Linear Systems by Graphing".

------------------------------
It is not always possible to obtain an exact solution when using the graphing method used to date. The following Try This activity shows a case where the graphing method may yield an ambiguous result.
 Try This 11
Solve the following system of equations by graphing. Use your own graph paper or the Graph Paper Template to complete this question.
x + 2y = 5
3x - 2y = 9
Possible TT 11 ( Try This 11) Solution
You may have noticed that the x-value and the y-value in the solution are not integers. As a result, it may have been difficult for you to identify the solution accurately.
------------------------------
Study the next example to see how you can use graphing technology to obtain a more precise solution.
Finding Points of Intersection using Technology
**A hand held graphing calculator is REQUIRED here **
Example 2
Use graphing technology to solve the following system of equations.
x + 2y = 5
3x – 2y = 9
Then verify the solution.
Solution 2
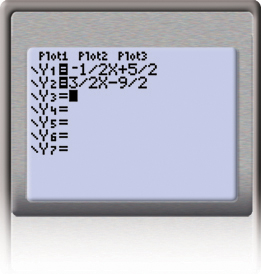
Step 1: Re-arrange each equation into slope-intercept form.
Step 2: Insert the re-arranged equations into your graphing calculator. Find the y= button on the top left. Use the x, T, θ, n button to put the x into the display and the (-) button to put in the negative in front of the 1/2x and the - (subtraction) button to put in the 9/2.
Step 3: Graph the equations. Hit graph ( button on the top right).
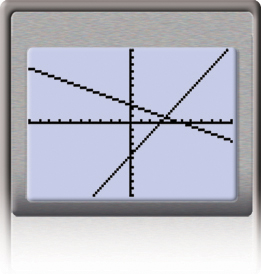
 Tip
Tip
For some systems, you may not be able to see the graphs when you press the “Graph” key because the window settings are not suitable. To remedy this, you can access the window settings of the graphing calculator to adjust your display. (Hit the window button - top middle). You will want to set your window so that you can see where the two lines intersect.
Step 4: Use the features of the graphing calculator or graphing software to determine the point of intersection. Do the following:
i. 2nd Trace to get to the Calc screen
ii. Choose option 5 - hit enter.
iii. Use the left and right arrow keys to make sure the cursor is on one of the curves to the LEFT of the intersection point. (it does not have to be that close to the point) Hit enter.
iv. Repeat step iii for the second curve. Hit enter.
v. Hit enter one more time and it will give you the final point of intersection.
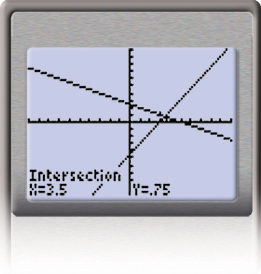
Step 5: You can verify the solution by substituting x = 3.5 and y = 0.75 into the original equations
Since both equations are satisfied, the solution to the linear system is (3.5, 0.75).
Systems of equations are helpful in solving problems where there are multiple unknown variables. As long as there is enough information, a solution or even multiple solutions can be found.
Watch and Listen
For an in depth summary of the of how to use the graphing calculator to find a point of intersection, use the link below.
"Solving Linear Systems by Graphing on a Graphing Calculator".
------------------------------
Modelling Problems Using Systems of Equations
The next Try This activity gives an example of a problem that can be modeled by a system of linear equations.
Try This 12 - 15
Kendra operates a mobile hot dog stand at a local week-long summer festival. Her cost to run the hot dog stand includes $1200 to rent the cart and $1 per hot dog. She charges her customers $2.50 for each hot dog. A system of equations that represents this scenario is given by
d = x + 1200
d = 2.5x
The variable d is dollars and the variable x is the number of hot dogs.
Complete the following questions in your binder. You NEED a graphing calculator here.
Try This 12 - 15 Questions
Use the link below to check your answers to Try This 12 - 15.
Possible TT 12-15 Solutions
The situation presented in TT 12 to TT 15 shows that there are two linear relationships that apply to a situation, but by solving them you identify where they intersect and whether they relate to each other. In this Try This activity, the solution is the point where cost and revenue are equal.
 Read
Read
Go to your textbook and work through an example showing how you can model a problem with a linear system and solve it by graphing.
Foundations and Pre-calculus Mathematics 10 (Pearson)
Read “Example 2: Solving a Problem by Graphing a Linear System” on pages 406 and 407. Why are the equations of the linear system set up the way they are? What can you learn about the way this system is written that can help you when you encounter similar problems later in this module?
Try This 16
Complete the following in your course folder ( binder).
Foundations and Pre-calculus Mathematics 10 (Pearson)
TT 21. Complete “Exercises” questions 3, 4, 5, 6, and 8 on page 409.
Use the link below to check your answers to Try This 16.
Possible TT 16 Solutions
Module 7: Systems of Linear Equations
Connect
You may find it helpful to fill in a chart, like the one linked below, to help you summarize the strategies you learn throughout the module.
Solving Linear Systems Strategies Table
 Lesson Assessment
Complete the lesson quiz posted under the Quizzes link to the left in moodle or under the Assess tab and ensure your work in your binder (course folder) is complete.
 Project Connection **NOT ASSIGNED**

© Prod. Numérik/12074798/Fotolia
Imagine you and a group of friends have decided to go on a trip. To help cover the costs of the trip, you and your friends have decided to do fundraising. First, your group plans to conduct a bottle drive in the community. Next, the group will buy a lawn mower and do yard work to raise money.
Go to the Unit 4 Project and complete the Module 7: Lesson 1 component of the project to answer questions about your fundraising projects.
![]() Going Beyond
Going Beyond
In this lesson you used graphing methods to solve systems of equations in two variables. Systems of equations can have more than two variables. For example, the following system contains three equations involving three variables:
x + y + z = 6
2x – y + z = 3
x + y – z = 0
Notice that in addition to the x and y, a third variable, z, has been introduced. It may be difficult for you to guess the values of x, y, and z that would satisfy this system. Fortunately, there are different methods for solving this system. How would you solve this system by graphing?
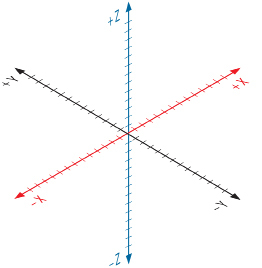
To graph points on a two-dimensional coordinate plane, you are accustomed to plotting ordered pairs (x, y). To graph points on a three-dimensional coordinate plane, like the one shown in the diagram, you need to plot ordered triples (x, y, z). The third axis, called the z-axis, rises up through the origin.
- Print a copy of the 3-D Coordinate Plane. Plot the following points:
- (3, 3, 3)
- (–2, 5,–8)
- (0, 10, 4)
- Follow the steps below to construct the graph of the equation 3x + 2y – z = 12.
- Find the x-intercept by substituting y = 0 and z = 0 into the equation.
- Find the y-intercept and z-intercept by using a similar method as in 2.a.
- Plot the three intercepts.
- Connect each intercept to the other with a line segment to form a triangle. This is the partial graph of 3x + 2y – z = 12.
- Use the Internet to search “online 3-D grapher” to find an applet that can help you visualize the graphs of equations in three variables. Once you find a suitable applet, enter each equation of the system found at the beginning of this section to see what their graphs look like. If the applet allows you to graph multiple equations on the same set of axes, you may be able to find the solution to the system!
Solving a system of equations in three variables by graphing is impractical without specialized software to help you visualize the solution. You will explore methods for solving such systems in subsequent Going Beyond sections.
Save your work in your course folder. Your teacher may ask to see them later.
Module 7: Systems of Linear Equations
Lesson 1 Summary
In this lesson you investigated the following questions:
- What is meant by the solution of a system of equations?
- How is solving a mathematical problem different from verifying a solution to the problem?
In this lesson you learned that a system of linear equations is a set of equations with multiple unknown variables. A linear system can be solved if there are at least as many equations in the system as there are unknowns. The solution to a system of equations identifies the value of each unknown variable such that those values would satisfy every equation in the system. For instance, if one equation describes costs and the other equation describes income, the intersection between the two is often referred to as the break-even point in business. At the break-even point, the business neither realizes a profit nor suffers a loss.
In previous modules you learned how to graph linear functions. In this lesson you built on those graphing skills by solving linear systems in two variables using graphing methods. You used both paper-and-pencil techniques as well as graphing technology to help you graph linear systems. You discovered that the point of intersection of the two lines of a linear system represents the solution to the system. This is due to the fact that the point of intersection lies on both lines, so its coordinates will satisfy both equations.
In addition to learning how to solve linear systems by graphing, you also learned how to verify your solutions. You learned that solving a system is different from verifying a solution. In solving a system, you follow a procedure that leads to the correct solution. On the other hand, verifying is the process of checking potential solutions against the original equations.
In Lessons 3 and 4 you will learn algebraic methods of solving systems of linear equations. At the end of the module, you will compare all of the strategies for solving linear systems including both graphing and algebraic ones.