Lesson 1
| Site: | MoodleHUB.ca 🍁 |
| Course: | Math 20-2 SS |
| Book: | Lesson 1 |
| Printed by: | Guest user |
| Date: | Tuesday, 30 December 2025, 7:51 AM |
Description
Created by IMSreader
1. Lesson 1
Module 3: Quadratics
Lesson 1: Investigating Quadratic Relations
Focus
Relations can be used to describe many different real-world scenarios. For example, Mathematics 10C demonstrated how linear relations can be used to describe the speed of a car. The speed of a car can be modelled by a linear relation of the form y = mx + b.

skateboard: iStockphoto/Thinkstock; dish: iStockphoto/Thinkstock; bridge: George Doyle/Stockbyte/Thinkstock
quadratic relation: a relation that can be written in standard form (y = ax2 + bx + c, where a ≠ 0); for example, 5x2 + 3x − 8
— Adapted from:
CANAVAN-MCGRATH ET AL.
Principles of Mathematics 11,
© 2012 Nelson Education Limited. p. 322.
Reproduced by permission.
Quadratic relations are another type of relation that can be used to model certain scenarios. For example, quadratic relations can be used to predict and graph the path of a skateboard in a jump. How high will the skateboard go? How far will it go? How long will it be in the air? The same is true for a thrown football, a flying hockey puck, or any projectile. Quadratic relations define the shape of satellite receivers, suspension bridge cables, and parabolic microphones.
Using quadratic relations will enable you to analyze a host of commercial and other real-world situations. Quadratic relations are useful for understanding many concepts in science, technology, business, or other fields.
Lesson Questions
This lesson will help you answer the following inquiry questions:
- How do you recognize a quadratic function?
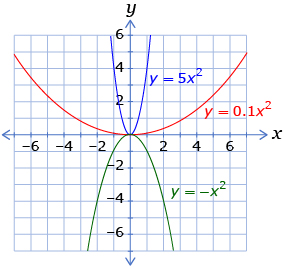
- How do the values of a, b, and c in the standard form, y = ax2 + bx + c, affect the shape and location of the graph?
Assessment
- Lesson 1 Assignment
All assessment items you encounter need to be placed in your course folder.
Save a copy of the Lesson 1 Assignment to your course folder. You will receive more information about how to complete the assignment later in this lesson.
Materials and Equipment
- graph paper
You may find it helpful to use 1-cm Grid Paper.
1.1. Launch
Module 3: Quadratics
Launch
This section presents questions to help you determine if you have the skills and knowledge to complete this lesson successfully. Before beginning this lesson, you should be able to
- fill in a table of values for relations
- draw a graph using the table of values
- identify whether or not a relation is a function
1.2. Are You Ready?
Module 3: Quadratics
Are You Ready?
-
- Complete the following data table for the relation y = 2x + 4.
x
0
1
2
3
−1
−2
0.5
y
Answer
- Draw a graph from the table of values from part a. Join the data points in a smooth curve. If you do not have graph paper of your own, you can use 1-cm Grid Paper. Answer
- Complete the following data table for the relation y = 2x + 4.
- This chart shows how much water vapour (in grams) a kilogram of air can hold at different temperatures.
Temperature
(°C)
Water Vapour
(g/kg of air)
−40
0.1
−35
0.2
−30
0.3
−25
0.51
−20
0.75
−10
1.8
0
3.8
5
5
10
7.8
15
10
20
15
25
20
30
27.7
35
35
40
49.8
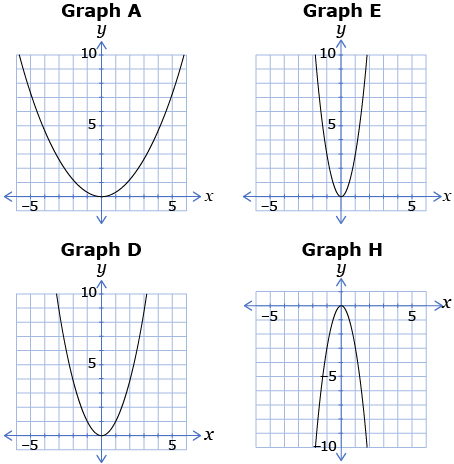
- For each set of graphs, state which graph is a function and which graph is not a function. Explain how you know.
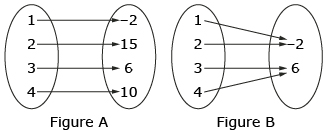
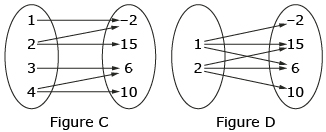
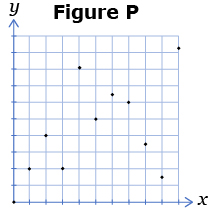
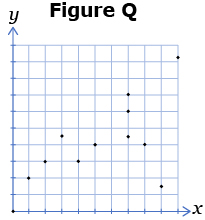
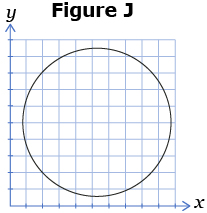
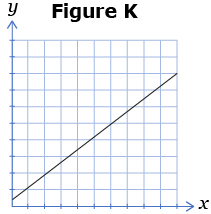
- For each of the following figures, tell which figures are functions and which are not. Give a reason for your answer.
- For each of the following ordered pairs, tell which sets are functions and which are not. Give a reason for your answer.


Answer
If you successfully completed the Are You Ready? questions, move on to the Discover section of the lesson.
If you experienced difficulties with the questions, use the resources in the Refresher section to review the concepts before continuing through the lesson.
1.3. Refresher
Module 3: Quadratics
Refresher
Go to Graph and watch the animation under the “Example (Mathematics)” heading to see how a table of values is used to graph a given equation. Continue to click “Play” after each step is revealed.
For information on determining the domain and range of a function, watch the “Domain and Range 1” video from the Khan Academy.
Khan Academy CC BY-NC-SA 3.0
Use the applet “Introduction to Functions” to determine whether a relation is a function. Make sure that “Show mapping diagram,” “Show ordered pairs,” and “Show graph” are selected. Follow the directions in the applet to create a relation. Select the “Show function test” boxes in each section to see whether or not the relation is a function. Use the Assessment Questions to verify that you are comfortable identifying whether a relation is a function or not.

Screenshot reprinted with permission of ExploreLearning.
Go back to the Are You Ready? section, and try the questions again. If you are still having difficulty, contact your teacher.
1.4. Discover
Module 3: Quadratics
Discover
Did You Know?
A quad is a four-wheel, all-terrain vehicle used for exploring the outdoors and having fun. Quad means “four.” But a quadratic relation has a variable taken only to the second power or, in other words, squared. The simplest example of a quadratic function is y = x2 or, as it is sometimes written, f(x) = x2. Where does the four come in?

iStockphoto/Thinkstock
The name came from having to find the area of the regular quadrilateral (four-sided figure) called a square. To determine the area of the square, you square the length of a side (s2) or multiply the length by itself (s × s).
Relations are rules that connect one value to another. Relations can be described as ordered pairs in which the first value is the input and the second value is the output. They can also be described in a table of values or using graphs.
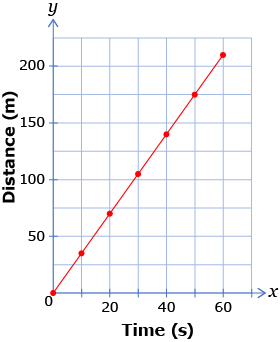
Many different situations can be modelled by relations. For example, the linear relation y = 3.5x could be used to model the movement of a quad travelling at a constant speed of 3.5 m/s over a given period of time.
Time (s) |
0 |
10 |
20 |
30 |
40 |
50 |
60 |
Distance (m) |
0 |
35 |
70 |
105 |
140 |
175 |
210 |
Likewise, the path of the quad in a jump can be modelled by a quadratic relation. For example, the quadratic relation y = −5x2 + 10x describes the path of a quad during a jump where the variable y represents the height of the quad above the ground and the variable x represents time.
x |
0 |
0.5 |
1 |
1.5 |
2 |
y |
0 |
3.75 |
5 |
3.75 |
0 |
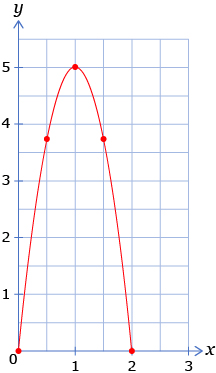
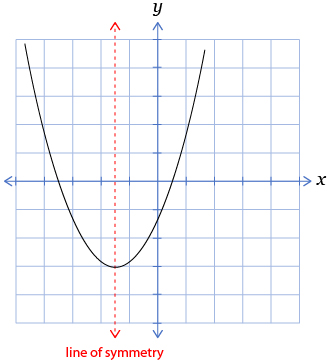
parabola: the curve-shaped graph of a quadratic relation
Notice that the graph of a linear relation is a straight line, whereas the shape of the graph of a quadratic relation is a parabola. All quadratic relations have a variable raised to the second power. Thus, all quadratic relations have a degree of 2.
For example, only one of the following functions is a quadratic function. Only one function has 2 as the highest power of the variable. If there is an exponent higher than 2 in the function, it is not a quadratic function.
| f(x) = 2x + 5 | This is a linear function—can be written as y = mx + b. |
| y = −0.2x + 5x + 4 | This is a linear function—can be written as y = mx + b. |
| f(x) = 3x3 + 5x2 + 2x + 9 | The highest power is 3, so this is not a quadratic function. |
| y = 3x2 + 6 | This is a quadratic function. (2 is the highest power of the variable.) |
Watch the video Exploring Parabolas and Polynomial Equations. Click the “Interactive” button to see other examples of quadratic relations that are used to study the flight path of objects.
1.5. Discover 2
Module 3: Quadratics
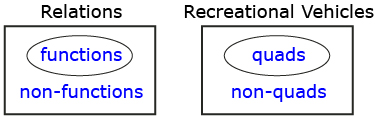
function: a relation where each input value has only one output value
A function is a relation where each input value corresponds to only one output value. There are several strategies you can use to determine whether a relation is a function. For instance, you can look at the ordered pairs to see if there is exactly one output value for each input value or you can perform a vertical line test on the graph of the relation. Recall that a graph represents a function if a vertical line cuts the graph only once.
![]()
Functions are to relations what quads are to all recreational vehicles. In other words, functions are a subset or special type of relation.
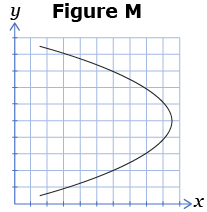
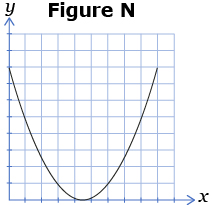
In the following examples, the relationship on the left is a function, whereas the relationship on the right is not. In the latter case, the vertical line crosses the parabola more than once showing that there is more than one output (y) value for some of the input (x) values.
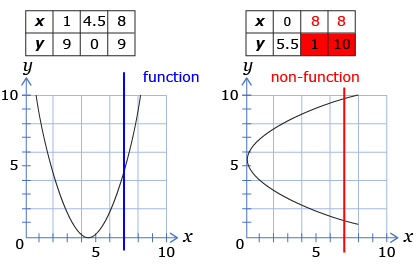
If you do not remember how to determine whether or not a relation is a function, go to the Refresher section of this lesson and watch Introduction to Functions. It is important that you are comfortable determining whether or not a relation is a function when you are given ordered pairs or a graph of the relation.
Share 1
With an appropriate partner, compare quadratic and linear relationships. (How are they the same? How are they different?)
In your discussion, consider the following:
- List real-life examples that are described by linear or quadratic relationships.
- Describe a linear relationship.
- Describe a quadratic relationship.
- Describe the graphs of these relationships.
- Explain how you can tell whether a graph represents a function or a non-function.
- Describe patterns created by linear relationships.
- Explain how these differ from patterns created by quadratic relationships.