Lesson 2
| Site: | MoodleHUB.ca 🍁 |
| Course: | Math 20-2 SS |
| Book: | Lesson 2 |
| Printed by: | Guest user |
| Date: | Tuesday, 30 December 2025, 8:17 AM |
Description
Created by IMSreader
1. Lesson 2
Module 3: Quadratics
Lesson 2: Graphs of Quadratic Functions
Focus
A batter focuses intently on the path of a baseball once it leaves the pitcher’s hand. The batter has only a fraction of a second to predict the ball’s speed and path and to decide to swing at the ball. If the batter decides to swing, the player must predict where the ball will be so that the bat can connect with the ball at the proper place and angle. The batter’s brain is predicting the path of the pitched fastball. This path can be accurately described mathematically using a quadratic function.

© Paul Yates/1096096/Fotolia
In this lesson you will look at how to analyze the characteristics of a quadratic function using its graph. The graph of a quadratic function can be useful in predicting the path of a baseball or other projectiles.
Lesson Questions
This lesson will help you answer the following inquiry questions:
- What characteristics of a quadratic function can be identified from the graph of the function?
- How can you tell the number zeros of a quadratic function given the coordinates of the vertex and the value of a in the quadratic function?
Assessment
- Lesson 2 Assignment
All assessment items you encounter need to be placed in your course folder.
Save a copy of the Lesson 2 Assignment to your course folder. You will receive more information about how to complete the assignment later in this lesson.
Materials and Equipment
- graph paper
You may find it helpful to use 1-cm Grid Paper.
1.1. Launch
Module 3: Quadratics
Launch
This section presents questions to help you determine if you have the skills and knowledge to complete this lesson successfully.
Before beginning this lesson, you should
- understand how changing a, b, and c affects the graph of y = ax2 + bx + c
- find the coordinates of points on the x-y plane
- locate a point on the x-y plane given its coordinates
1.2. Are You Ready?
Module 3: Quadratics
Are You Ready?
- In Lesson 1 you looked at how changing the values of a, b, and c affect the graph of a function written in standard form (y = ax2 + bx + c). Use the interactive Do You Know Your ABCs? to ensure you know your ABCs of the quadratic function written in standard form.
On the right side of the applet, you will see sliders that can be used to change the values of a, b, and c. Before moving the sliders, consider the following:
- Each graph has the same shape, so what does that tell you about the value of a?

- Each graph has a different y-intercept. What does that tell you about the values of c for the graphs?
- You may find it helpful to choose one of the coloured graphs to determine the values of a and b first.
Values that Hide the Dashed Curve
Curve Colour
Light Blue
Blue
Purple
Red
Orange
Green
Dark Green
Dark Blue
Dark Purple
a-value
b-value
c-value
- Each graph has the same shape, so what does that tell you about the value of a?
Complete the following Are You Ready? questions to be sure you have mastered the prerequisite skill of identifying the coordinates of any point on a grid.
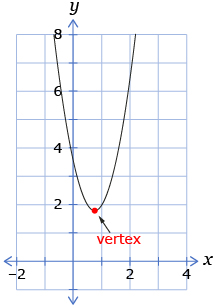
- Use the following graph to answer questions 2.a. to 2.c.
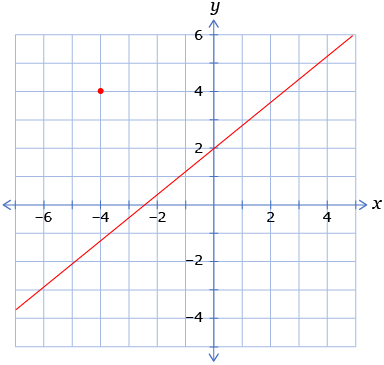
- What are the coordinates of the red dot in the graph?
- What are the coordinates of the point where the graph crosses the x-axis? (This point is called the x-intercept.)
- What are the coordinates of the point where the graph crosses the y-axis? (This point is called the y-intercept.)
- What are the coordinates of the red dot in the graph?
-
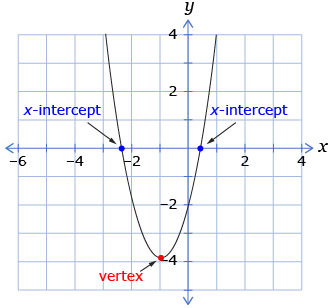
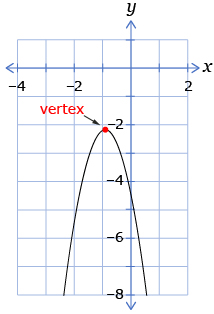
Use the following graph to answer questions 3.a. to 3.c.
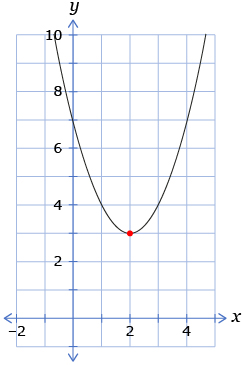
- What are the coordinates of the red dot in the graph of the parabolic function?
- What are the coordinates of the point where the parabolic graph crosses the x-axis? (This point is called the x-intercept.)
- What are the coordinates of the point where the parabolic graph crosses the y-axis? (This point is called the y-intercept.)
- What are the coordinates of the red dot in the graph of the parabolic function?
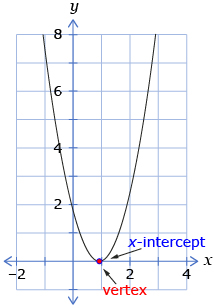
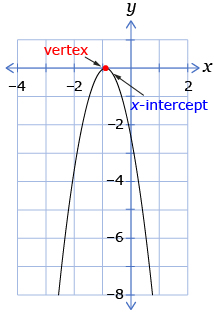
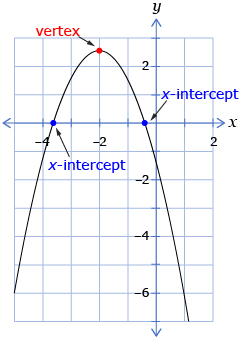
- Use the following graph to answer questions 4.a. to 4.c.
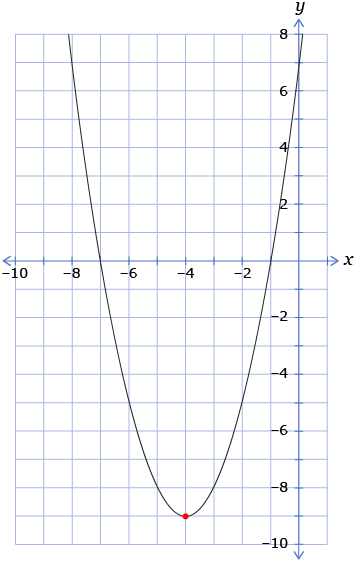
- What are the coordinates of the red dot in the graph of the parabolic function?
- What are the coordinates of the point where the parabolic graph crosses the x-axis? (This point is called the x-intercept.)
- What are the coordinates of the point where the parabolic graph crosses the y-axis? (This point is called the y-intercept.)
- What are the coordinates of the red dot in the graph of the parabolic function?
If you successfully completed the Are You Ready? questions, move on to the Discover section of the lesson.
If you experienced difficulties with the Are You Ready? questions, use the resources in the Refresher section to review the concepts before continuing through the lesson.
1.3. Refresher
Module 3: Quadratics
Refresher
If you struggled with changing the value of a, b, and c to match the coefficients and constants of the standard form of a quadratic function to its graph, you may find it helpful return to Lesson 1 and review the Explore section.
Review the definition of Coordinates. Then click on the tiny green square and drag it to different positions to see how the coordinates change. Be sure to see it in all four quadrants.
Go back to the Are You Ready? section, and try the questions again. If you are still having difficulty, contact your teacher.
1.4. Discover
Module 3: Quadratics
Discover
Objects thrown or projected through the air tend to follow a parabolic path that can be described using a quadratic function. The path is called a trajectory. In your Module 3 Project, you will analyze the trajectory of projectiles based on data about the paths of the projectile.

The game Angry Birds, which held the spot as the number one paid app on the iPhone in many countries, requires users to use physics, mathematics, and logic to save stolen eggs.
In the game, being able to determine the trajectory of a bird is one strategy that can be used to destroy the enemy and capture stolen eggs. Each type of bird has unique characteristics. These characteristics affect the flight patterns of each bird. Contestants can change the angle at which the birds take-off in order to change its path and, hopefully, hit the intended target.
How is an understanding of the characteristics of quadratic functions a useful strategy for determining where birds that have a parabolic shaped trajectory will end up?
The shape and other characteristics of a parabola depend on the situation the quadratic function is modelling. For instance, some situations may have a parabola that opens upwards while other situations may have a parabola that opens downwards.
In Lesson 1 you identified certain characteristics of a quadratic function written in standard form y = ax2 + bx + c. You noticed that changing the value of a changes the shape of the graph while changing only b and c translates the parabola horizontally or vertically. From the graph of quadratic functions, you were able to see that the
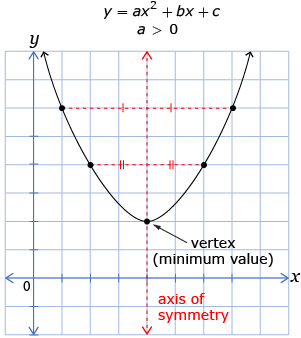
- highest or lowest point on the graph of the quadratic function lies on the parabola’s vertical line of symmetry
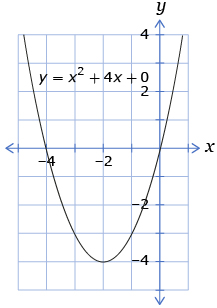
- value of the parabola’s y-intercept is the same as the constant term, c, in the standard form of the quadratic
maximum value: the greatest value within the range (y-values) of a relation
minimum value: the least value within the range (y-values) of a relation
There are other characteristics of quadratic functions that can be used to help solve problems. For example, it is useful to know where the graph crosses the x-axis or what the maximum value or minimum value is for the graph.
Try This 1
Use the interactive applet Quadratic Graph Properties to determine additional characteristics of graphs of quadratic functions.
Use the a, b, and c sliders to create the following graphs. In your solutions, include a sketch or screenshot of the graph; the function that determines the graph; and the values of a, b, and c.
- Create a graph that opens up and crosses the x-axis two times.
- Create a graph that opens up and touches the x-axis once.
- Create a graph that opens up and does not touch the x-axis.
- Create a graph that opens down and crosses the x-axis two times.
- Create a graph that opens down and touches the x-axis once.
- Create a graph that opens down and does not touch the x-axis.
![]() Place a copy of your graphs in your course folder.
Place a copy of your graphs in your course folder.
Share 1
With a partner, compare the graphs that you created for Try This 1. Discuss how the shape of the graph is affected by the positive or negative value of a.
![]() Place a copy of your Share 1 answer in your course folder for reference.
Place a copy of your Share 1 answer in your course folder for reference.
1.5. Explore
Module 3: Quadratics
Explore
You may have noticed when you were creating different graphs in the Discover section that the number of times the parabola touches or crosses the x-axis depends on whether the graph opens up or down and the location of the vertex (minimum or maximum value) of the graph.
from: CANAVAN-MCGRATH ET AL. Principles of Mathematics 11, © 2012 Nelson Education Limited. p. 323. Reproduced by permission.
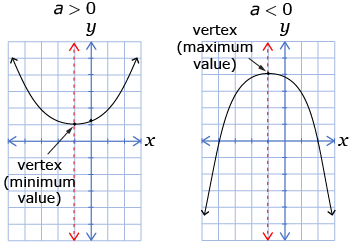
If the value of a is positive, the graph will open upwards. If the value of a is negative, the graph will open downwards. In each case, the position of the vertex will determine whether there are two, one, or zero x-intercepts.
If a is positive, the graph opens upwards and the following statements are true:
- If the vertex is below the x-axis, there will be two x-intercepts because both arms of the parabola will cross the x-axis.
- If the vertex is on the x-axis, there will be one x-intercept because the parabola touches the x-axis at one point.
- If the vertex is above the x-axis, there will be zero x-intercepts because the parabola will never cross the x-axis.
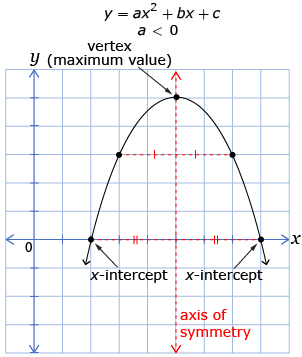
If a is negative, the graph opens downwards and the following statements are true:
- If the vertex is below the x-axis, there will be zero x-intercepts because the parabola will never cross the x-axis.
- If the vertex is on the x-axis, there will be one x-intercept because the parabola touches the x-axis at one point.
- If the vertex is above the x-axis, there will be two x-intercepts because both arms of the parabola will cross the x-axis.
If you are given the vertex and the direction of opening, can you decide how many x-intercepts the graph of the quadratic function will have?
1.6. Explore 2
Module 3: Quadratics
Self-Check 1
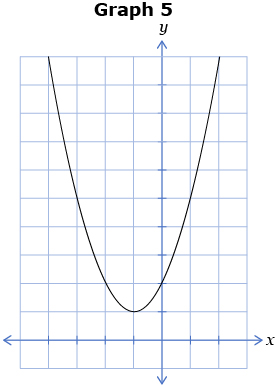
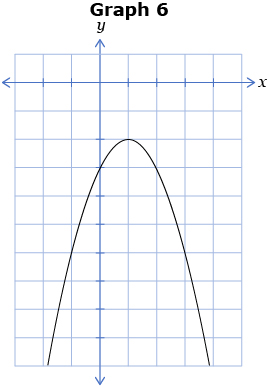
Study the following six graphs. Note the vertex location, the direction of opening, and the number of x-intercepts for each graph.
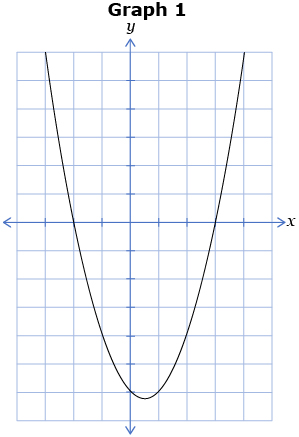
Fill in the blanks to make each of the following statements true.
- The first blank can be replaced with the words below, above, or on.
- The second blank can be replaced with the words up or down.
- The third blank can be filled in with the numbers zero, one, or two.
- Graph 1 has a vertex ________ the x-axis, is opening ______, and has ____ x-intercept(s). Answer
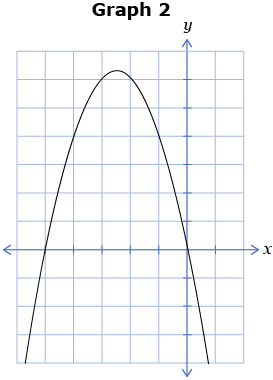
- Graph 2 has a vertex ________ the x-axis, is opening ______, and has ____ x-intercept(s). Answer
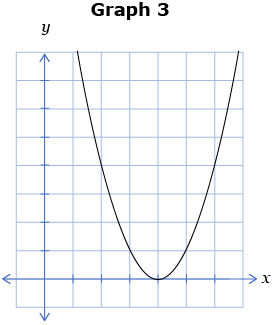
- Graph 3 has a vertex ________ the x-axis, is opening ______, and has ____ x-intercept(s). Answer
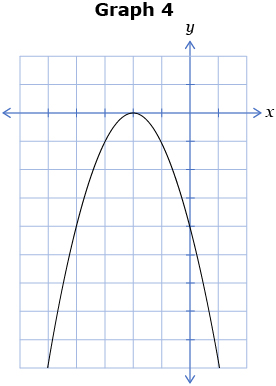
- Graph 4 has a vertex ________ the x-axis, is opening ______, and has_____ x-intercept(s). Answer
- Graph 5 has a vertex ________ the x-axis, is opening ______, and has ____ x-intercept(s). Answer
- Graph 6 has a vertex ________ the x-axis, is opening ______, and has ____ x-intercept(s). Answer
1.7. Explore 3
Module 3: Quadratics
As you have seen, quadratic functions can be used to model different situations. The characteristics of graphs of quadratic functions can be used to gather information about a situation. This information can be helpful in solving problems.

Hemera/Thinkstock
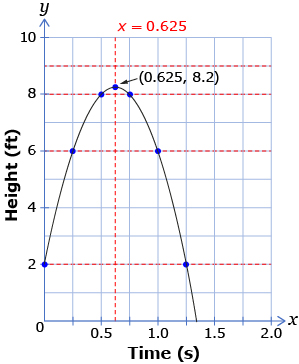
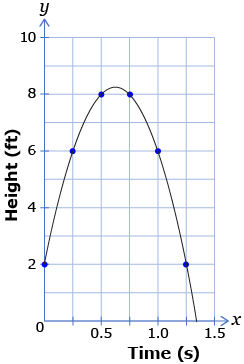
Read “Learn About the Math” on pages 325 and 326 of the textbook. Note that the information Marko collected with his camera is the height of the volleyball at given times. This is not the same as the path of the volleyball, which would be height and horizontal distance. As you read through the example, consider how Marko used symmetry to estimate when the volleyball reached its maximum height.
Self-Check 2
Complete “Reflecting” questions A, B, and C on page 326 of the textbook. Answer
Marko used the data he collected to sketch a graph of the height of the volleyball against time. The graph was shaped like a parabola. From this graph, Marko was able to determine when the volleyball reached its greatest height. Marko noticed that the maximum height of the graph corresponds with the maximum value, or vertex, of the graph. He used points that have the same y-value to determine the equation of the axis of symmetry. The axis of symmetry is halfway between the two points with the same y-values.
axis of symmetry: a line that splits a figure such that both parts are mirror images of each other
Adapted from: CANAVAN-MCGRATH ET AL. Principles of Mathematics 11, © 2012 Nelson Education Limited. p. 326. Reproduced by permission.
Use the applet Axis of Symmetry to explore the axis of symmetry in connection with the vertex and x-intercepts for different quadratic functions. Use the sliders for a, b, and c to create different parabolas.
1.8. Explore 4
Module 3: Quadratics
![]()
Here is a way to help you remember that domain is all possible x-values and range is all possible y-values. Write x and y in alphabetical order, and write domain and range in alphabetical order.
- x, y
- domain, range
Another way to describe a quadratic function and its parabolic graph is by its domain and range. Recall that the domain is all possible x-coordinates on the graph. The range is all possible y-coordinates on the graph.
In the quadratic function y = ax2 + bx + c, the domain is all possible values of x and the range is all possible values of y.
If you were to project a “shadow” of a graph onto the y-axis, the resulting interval corresponds to the range of the relation. If you project a “shadow” of a graph onto the x-axis, the resulting interval corresponds to the domain of the relation.
Try This 2
The Domain and Range applet allows you to see the “shadow” that the domain of the relation casts on the horizontal axis and the “shadow” that the range of the relation casts on the vertical axis.
Use the applet to answer the following questions. Note: The shadows for the domain and the range are different colours. The shadow tells you the domain and the range of each relation.
- Select the “Circle” graph. Slide the domain slider down to the bottom to see the shadow.
- How would you express the domain of the circle in words?
- How would you express the domain of the circle in symbols?
- Express the range of the circle in words and in symbols. (You can move the “Range Shadow” slider all the way to the left to see the range shadow.)
- How would you express the domain of the circle in words?
- Now de-select the “Circle” graph, and select the “Quadratic 1” graph.
- When the quadratic 1 function is written in standard form, would the value of a be greater than or less than zero? How do you know?
- What is the domain of the Quadratic 1 function?
- What is the range of the Quadratic 1 function?
- When the quadratic 1 function is written in standard form, would the value of a be greater than or less than zero? How do you know?
- Now de-select the “Quadratic 1” graph, and select the “Quadratic 2” graph.
- When the Quadratic 2 function is written in standard form, would the value of a be greater than or less than zero? How do you know?
- What is the domain of the Quadratic 2 function?
- What is the range of the Quadratic 2 function?
- When the Quadratic 2 function is written in standard form, would the value of a be greater than or less than zero? How do you know?
1.9. Explore 5
Module 3: Quadratics
For this module on quadratics, it is important to know the following:
- The domain of a quadratic function is always a member of the real numbers.
- The range is always greater than or equal to the minimum value if the parabola opens upwards.
- The range is less than or equal to the maximum value if the parabola opens downwards.
When determining domain and range, or any characteristics of the graph of a quadratic function, it is important to think about what situation is being modelled by the data. For instance, in Self-Check 2, you looked at a graph of the height of a volleyball versus time. In this situation, a negative height is not possible—it would mean that the volleyball went through the floor! If you were to give the range for this graph, it could not be less than zero.
|
Time (s) |
Height (ft) |
|
0.00 |
2 |
|
0.25 |
6 |
|
0.50 |
8 |
|
0.75 |
8 |
|
1.00 |
6 |
|
1.25 |
2 |
Adapted from: CANAVAN-MCGRATH ET AL. Principles of Mathematics 11, © 2012 Nelson Education Limited. p. 325. Reproduced by permission.
It is important to always keep the context of the problem in mind. This helps you to ensure that the values you determine for the characteristics of the graph make sense or are reasonable for the given situation.
Read “Example 2: Reasoning about the maximum value of a quadratic function” on pages 327 and 328 of the textbook. In this example, the function models the path of water at a children’s splash park. How does Manuel use his understanding of the characteristics of quadratic functions to solve the problem?
![]()
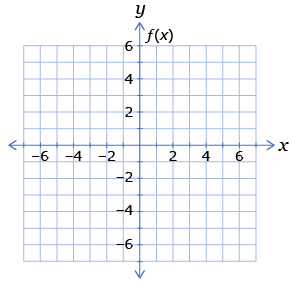
Although the standard form of the quadratic function has been written as y = ax2 + bx + c, it can also be written as f(x) = ax2 + bx + c. The left side is then read as “the function of x.” The f(x) replaces the y in the equation. If this form is used, the vertical axis on the graph would need to be labelled as f(x) like the following graph.
Letters that have specific meanings, other than x and y, can be used to write quadratic functions. In physics, t is used to represent time and v is used for velocity. A quadratic function used in physics where the f(t) represents the distance travelled by an accelerating object is  . The letters chosen for variables often represent specific quantities, such as d for distance and m for mass. You can use any letter: you just have to say what it represents. Sometimes even Greek letters are used, such as theta (
![]() ), mu (μ), and phi (
), mu (μ), and phi ( ).
).
Try This 3
Go to the interactive applet Graphs of Quadratic Functions to use the characteristics of graphs of quadratic functions to solve problems.
Once you log in, you need to choose “Graphs of Quadratic Functions” from the list. There are five sections to the applet—click on each icon at the top of the page and then work through each section.
You may want to take a screenshot of the “Summing Up” pages and place these in your notes organizer.
1.10. Explore 6
Module 3: Quadratics
Suppose you are given the vertex of a parabola (6, 8) and one of the x-intercepts (2, 0). From this information, you can determine the following:
- the coordinates of the other x-intercept
- whether the value of a in the quadratic function is negative or positive
- the maximum or minimum value of the function
This information can be determined without drawing the graph by using the axis of symmetry and some reasoning. Since the vertex is at (6, 8), the axis of symmetry is at x = 6. The given x-intercept (2, 0) is 4 units to the left of the axis of symmetry (6 − 2 = 4). Therefore, the other x-intercept will be 4 units to the right side of the axis of symmetry at x = (6 + 4), or x = 10.
Remember that the value of a in the quadratic function y = ax2 + bx + c indicates whether the parabolic graph of the quadratic function opens upwards or downwards. If a is positive, the graph opens upwards and the vertex is the minimum value of the function. If a is negative, the graph opens downwards and the vertex is the maximum value of the function. The given x-intercept (2, 0) is below the vertex (6, 8); so the graph must open downwards. This tells us the value of a in the quadratic function is negative and the vertex is a maximum.
Therefore, the maximum value of the function is 8, the value of y at the vertex.
Self-Check 3
- Use the following graph to complete this question.
For the graph, describe the
- vertex
- direction of opening
- axis of symmetry
- domain
- range
- x-intercepts
- y-intercept
- maximum or minimum value of the function
Answer
- vertex
- Use the following graph to complete this question.
 For the graph, describe the
- vertex
- direction of opening
- axis of symmetry
- domain
- range
- x-intercepts
- y-intercept
- maximum or minimum value of the function
Answer
- vertex
- Using the principles of symmetry, sketch the graph of y = −2x2 +16x − 16. Use the following information to sketch your graph:
- The vertex is at (4, 16).
- One point on the graph is (2, 8).
- Another point on the graph is (0, −16).
Answer
Did you notice that the y-intercept is the same as the value of c in the standard form of the quadratic function y = ax2 + bx + c? Look back at the graphs in Self-Check 3. Observe how the constant at the end of the function is always the y-intercept. That will always be true.
To see why, put the value of 0 in for x in the standard form of the quadratic function.
y = ax2 + bx + c
y = a(0)2 + b(0) + c
Can you see that for a quadratic function in standard form, the y-intercept will be y = c?
If you haven’t done so already, you may want to add the characteristics of quadratic functions that you studied in this lesson to your notes organizer. Check out “In Summary” on page 332 of the textbook for some key ideas and concepts that were covered in this lesson.
Self-Check 4
If you feel you need a bit more practice, you may complete all or parts of “Check Your Understanding” questions 1, 3, 4, 5, and 6 on pages 332 to 334 in the textbook. When you finish a question, check your work using the shortened answers given on page 550 at the back of the textbook. If you are still unclear about how to answer some questions, make sure to contact your teacher to get some assistance.
Recall from the Course Introduction that you will be creating your own course glossary. Open the Glossary Terms document that you saved to your course folder, and add in any new terms. You might choose to add the following terms to your copy of Glossary Terms:
- maximum value
- minimum value
- vertex
- x-intercept
- axis of symmetry
1.12. Lesson 2 Summary
Module 3: Quadratics
Lesson 2 Summary
from: CANAVAN-MCGRATH ET AL. Principles of Mathematics 11, © 2012 Nelson Education Limited. p. 332. Reproduced by permission.
from: CANAVAN-MCGRATH ET AL. Principles of Mathematics 11, © 2012 Nelson Education Limited. p. 332. Reproduced by permission.
In this lesson you found that the coordinates of the vertex of the parabola are for the point of maximum or minimum value of the quadratic function. The coordinates of this point can be determined from the graph. The axis of symmetry is the x-value of the vertex.
The domain will be all values of x that are possible for the function. It is symbolically written as  when it includes all real numbers. The range is all the values of y that are possible for the function. It is symbolically written as
  when it includes all real numbers greater than 7, for example. When determining domain and range, it is important to consider the situation that is being modelled. Is it possible for a value to be below zero?
If the value of a is positive, the graph will open upwards. If the value of a is negative, the graph will open downwards. In each case, the position of the vertex will determine whether there are two, one, or zero x-intercepts.
If a is positive, the graph opens upwards and the following statements are true:
- If the vertex is below the x-axis, there will be two x-intercepts because both arms of the parabola will cross the x-axis.
- If the vertex is on the x-axis, there will be one x-intercept because the parabola touches the x-axis at one point.
- If the vertex is above the x-axis, there will be zero x-intercepts because the parabola will never cross the x-axis.
If a is negative, the graph opens downwards and the following statements are true:
- If the vertex is below the x-axis, there will be zero x-intercepts because the parabola will never cross the x-axis.
- If the vertex is on the x-axis, there will be one x-intercept because the parabola touches the x-axis at one point.
- If the vertex is above the x-axis, there will be two x-intercepts because both arms of the parabola will cross the x-axis.
In Lesson 3 you will investigate how to use a graphing technology to find the maximum or minimum value, the axis of symmetry, the x- and y-intercepts, and the coordinates of the vertex.