Lesson 3
| Site: | MoodleHUB.ca 🍁 |
| Course: | Math 20-2 SS |
| Book: | Lesson 3 |
| Printed by: | Guest user |
| Date: | Tuesday, 30 December 2025, 9:47 AM |
Description
Created by IMSreader
1. Lesson 3
Module 3: Quadratics
Lesson 3: Quadratic Functions and Graphing Calculators
Focus

© mattei/613071/Fotolia
A trebuchet is a type of very powerful catapult that medieval invaders sometimes used for throwing heavy stones at castle walls. Today, hobbyists build them for throwing pumpkins and even automobiles for sport or in contests. Whether you are using a trebuchet for moving heavy objects or throwing an egg using your arm, the path of the projectile can be accurately described mathematically using a quadratic function. However, the coordinates and intercepts aren’t usually the tidy whole numbers that have appeared in this module so far. You need a way to find the values for quadratic functions that are not just integers.
In this lesson you will learn how to use graphing calculators to draw the graphs and identify the values of the coordinates of the vertex, the x- and y-intercepts, the axis of symmetry, and the domain and range of a quadratic function. Learning these new skills will provide you with the ability to predict the path of a stone or other projectile, which is a skill you will need for your project.
Lesson Questions
This lesson will help you answer the following inquiry questions:
- How can you use a graphing calculator to draw the graph of a quadratic function?
- How can you use a graphing calculator to identify the coordinates of the vertex, domain and range, axis of symmetry, and x- and y-intercepts of the graph of a quadratic function?
Assessment
- Lesson 3 Assignment
All assessment items you encounter need to be placed in your course folder.
Save a copy of the Lesson 3 Assignment to your course folder. You will receive more information about how to complete the assignment later in this lesson.
Materials and Equipment
- graphing calculator
1.1. Launch
Module 3: Quadratics
Launch
Before beginning this lesson, you should be able to identify the following on the graph of a quadratic:
- coordinates of the vertex
- domain and range
- axis of symmetry
- x- and y-intercepts
1.2. Are You Ready?
Module 3: Quadratics
Are You Ready?
The following is a graph of the quadratic function y = 2x2 − 8x + 6.
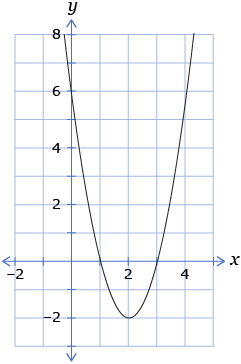
- What are the coordinates of the vertex in the graph of the parabolic function? Answer
- What is the domain of the function? Answer
- What is the range of the function? Answer
- What are the coordinates of the x-intercept? Answer
- What are the coordinates of the y-intercept? Answer
- What is the axis of symmetry for the graph? Answer
- What is the minimum value of the function? Answer
If you successfully completed the Are You Ready? questions, move on to the Discover section of the lesson.
If you experienced difficulties, use the resources in the Refresher to review the concepts before continuing through the lesson.
1.3. Refresher
Module 3: Quadratics
Refresher
Go back to Lesson 2 of this module to review the Lesson 2 Summary and other parts of the lesson, as needed.
You may also try using the Axis of Symmetry applet to create different quadratic functions and identify the x-intercepts, y-intercept, axis of symmetry, and vertex for the graphs.
Go back to the Are You Ready? section, and try the questions again. If you are still having difficulty, contact your teacher.
1.4. Explore
Module 3: Quadratics
Explore
In Lesson 2 you used graphs to help solve problems that could be modelled by a quadratic function. Your graphing calculator is another tool you can use to solve problems involving quadratic functions. Your graphing calculator can be used to identify the coordinates of the vertex, help determine the domain and range, find maximum and minimum values, locate x- and y-intercepts, and determine the equation for the axis of symmetry of quadratic functions.

© Douglas J Glass/8207240/Fotolia
Watch the animation Using the TRACE Feature on Your Calculator to see how to enter a function into your calculator and use the TRACE features to find values on the graph.
You may have noticed that when using the ZOOM feature to find the x-intercepts, it is sometimes difficult to get your calculator to stop exactly at y = 0 to find the exact value of the x-intercept. You may have also found it difficult to be sure you had the exact minimum or maximum point as well. The calculator offers you help! There is a CALCULATE feature that you can access that will help find the exact coordinates for these points.
Watch the applet Using the CALCULATE Feature on Your Graphing Calculator to see how you can use your calculator to find exact coordinates.

1.5. Explore 2
Module 3: Quadratics
Share 1
Based on your observations from the two animations, discuss the following questions with another student or appropriate partner.
- Explain how you can use a graphing calculator to find the following for a quadratic function:
- coordinates of the vertex
- range
- axis of symmetry
- x- and y-intercepts
- What settings with the ZOOM key seemed to be the greatest help?
- Which method did you find easiest for finding x-intercepts: the ZOOM method or the CALCULATE (zero) method? Explain.
- Summarize your discussion by creating a short paragraph describing how to find the vertex and intercepts of a quadratic function using a graphing calculator.
![]() Place a copy of your summary in your course folder.
Place a copy of your summary in your course folder.
Self-Check 1
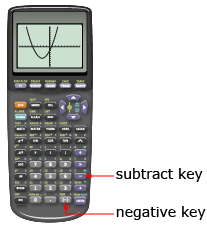
Change the function in your calculator from Y1 = 0.6x2 + 3x + 2 to Y1 = 0.6x2 + 3x − 2. Note: Ensure you use the subtract key and negative key appropriately.
Be careful that you correctly include any of the negative signs when discussing the coordinates of the vertex, the x- and y-intercepts, and the axis of symmetry. They are vitally important.
Use a graphing calculator to find the following. Where necessary, make sure to round your answer to two decimal places.
1.6. Explore 3
Module 3: Quadratics
Sometimes it is helpful to specify the exact zoom you want on the screen.
Try This 1
Change the function in your calculator to Y1 = −0.4x2 + 7.2x − 14. Note that you must use the negative key, not the subtract key, in front of the 0.4.
Using the default window settings gives a graph that is too big for the screen. If you zoom out, the scale is too large and the grid scale is unreadable. You can set the scale of your graph using the WINDOW key. Change the WINDOW settings so the screen looks like the following:
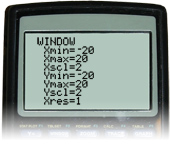
The “Xmax=20” tells you the scale on the x-axis will have a maximum value of 20. The “Xscl=2” tells you the scale on the x-axis will go up by 2. Now press the GRAPH key and see the graph clearly. Use the TRACE or CALCULATE feature to answer the following questions.
For the graph of the quadratic function Y1 = −0.4x2 + 7.2x − 14, use a graphing calculator to find the following to one decimal place when necessary:
- y-intercept
- first x-intercept
- coordinates of the vertex
- axis of symmetry
- maximum value
- second x-intercept
![]()
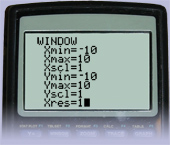
To reset the window settings back to the original default settings, you can access the WINDOW settings and enter in the values. Sample default window settings are shown.
Another approach is to reset the calculator to the default values.
- Press the 2nd key, which is below the Y= key.
- Press the + key. You have used the 2nd key; therefore, the second function of the + key, MEMORY, will be used.
- Select the Reset option (5 or 7, depending on your calculator).
- Select 2:Defaults....
- Select 2:Reset.
This will reset your entire calculator to the factory settings. You will need to put your calculator back in Degree mode.
Sometimes it is helpful to use this reset sequence if you have a screen that won’t display what you need it to because of previous inputs.
Directions to do this are also available in Reset the Graphing Calculator.
A table of values can also be used to help you determine an appropriate viewing window for the graph on your graphing calculator.
Read “Example 4: Locating a vertex using technology” on pages 330 and 331 of the textbook. As you read, consider how Isidro uses a table of values on a graphing calculator to make sure the graph models the situation.
1.7. Explore 4
Module 3: Quadratics
Self-Check 2
Try This 2
Sometimes you will come across a question where you don’t know how to solve the quadratic function to find the required answer. In these cases, your graphing calculator can be a great help. Use the applet Goal to see how a graphing calculator can be used to determine how far from the net a hockey player needs to be in order to score a goal.

Hemera/Thinkstock
The fastest hockey shot ever officially recorded was by Boston Bruins defenseman Zdeno Chara at a blistering 170 km/h. There is a controversy over that record, because Bobby Hull is reported to have shot a puck at the staggering speed of 190 km/h while skating at high speed down the ice.

© Rebecca Hanson/2506342/Fotolia
1.8. Explore 5
Module 3: Quadratics
The graphing calculator is just another tool you can use to help solve problems that can be modelled by quadratic functions. By applying the characteristics of quadratic functions you learned in Lessons 1 and 2, you can ensure that the graph you are seeing on the calculator is a reasonable representation of the function. For instance, if the graph of a function with a negative a (a < 0) value when written in standard form opens upwards and has a minimum value on your calculator screen, chances are you forgot to enter the minus sign. Thus, it is a good idea to always keep in mind the key characteristics of the graph you are working with.
Self-Check 3
Complete “Practising” questions 12, 13, and 16 on pages 335 and 336 of the textbook. Answer

Travel Alberta
1.9. Connect
Module 3: Quadratics
Connect
Lesson Assignment
Complete the Lesson 3 Assignment that you saved to your course folder.
Project Connection
Complete Part 1 of the Module 3 Project.
Going Beyond
See what information you can find on how the trebuchet works by searching on the Internet. Look for both ancient and modern applications.

iStockphoto/Thinkstock
1.10. Lesson 3 Summary
Module 3: Quadratics
Lesson 3 Summary

In this lesson you investigated how the graphing calculator can be used as a tool to help solve problems modelled by quadratic functions. You found that you could enter a quadratic function into a graphing calculator by pressing the Y= key. Once the function was entered, you could see the graph by pressing the GRAPH key. You learned how to adjust the scale and the amount of the graph shown by changing the values displayed when the WINDOW key was pressed.
You also learned that points on the graph, such as the coordinates of the vertex and the x- and y-intercepts, could be identified using the TRACE key. It also enabled you to find values on the graph that were approximately close to the points you were interested in.
Using the CALCULATE feature, you could input values for x and the calculator would tell you the corresponding y-values. Using this feature, you could find exact values for the x-intercepts and maximum or minimum points with ease.
By applying the characteristics of quadratic functions you learned in Lessons 1 and 2, you could ensure that the graph you were seeing on the calculator was a reasonable representation of the function.
In the next lesson you will investigate other forms of the quadratic function, besides the standard form y = ax2 + bx + c, which you are now familiar with.