Lesson 2
| Site: | MoodleHUB.ca 🍁 |
| Course: | Math 20-2 SS |
| Book: | Lesson 2 |
| Printed by: | Guest user |
| Date: | Tuesday, 30 December 2025, 7:26 AM |
Description
Created by IMSreader
1. Lesson 2
Module 6: Proportional Reasoning
Lesson 2: Representing Rates with a Graph
Focus
Hemera/Thinkstock
One rate that sparks much debate is the cost of gasoline. It is one rate that some people check daily. As the price of gas and environmental awareness rise, the push for more fuel-efficient vehicles increases.
Scientists, inventors, and manufacturers are looking at various car designs and alternative fuel sources. Hybrids, electronic cars, solar cars, cars that can run on biofuels, and even cars that run on used oil from deep fryers have been developed. Creating more aerodynamic designs and using lighter building materials are two other ways car designers are trying to increase fuel efficiency for vehicles.
Did You Know?
Progressive Insurance held a $10 million dollar Automotive X PRIZE competition where contestants had to create a mass-market car that could get more than 100 mi to the gallon. That’s about 2.35 L per 100 km! Want to check out some of these X CARS, including the eVaro from Maple Ridge, BC? For more information, type “Progressive Automotive X Prize” or “X CARS” into your favourite Internet search engine.
Fuel consumption or fuel efficiency is expressed as a rate (usually in litres per 100 km or miles per gallon). Graphs can be used to represent and compare the fuel efficiency of different vehicles.
This lesson will help you answer the following inquiry questions:
- How can graphs be used to represent and compare rates?
- How can rates be used to solve problems?
Assessment
- Lesson 2 Assignment
All assessment items you encounter need to be placed in your course folder.
Save a copy of the Lesson 2 Assignment to your course folder. You will receive more information about how to complete the assignment later in this lesson.
Materials and Equipment
- calculator
- 1-cm Grid Paper or 2-cm Grid Paper
- ruler or straightedge
1.1. Are You Ready?
Module 6: Proportional Reasoning
Are You Ready?
- What is meant by the slope of a line? Answer
- State which line in the following graph has a slope that is
- positive
- negative
- zero
- undefined
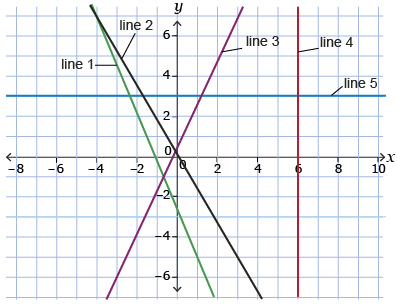
Answer
- Calculate the slope of each line.
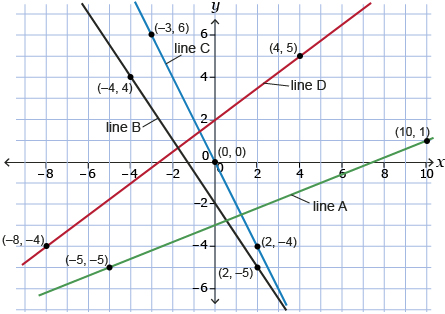
Answer
- Find the slope of a line given the following points on the line.
- (3, 2) and (6, 8)
- (−4, 6) and (5, −1)
- (−2, −3) and (3, 4) Answer
1.2. Refresher
Module 6: Proportional Reasoning
Refresher
The slope of a line is the measure of the line’s steepness. You can interpret slope in three equivalent ways:
Slope can have positive or negative values, be equal to zero, or be undefined. The slope of a line depends on its orientation. Specifically, this includes the following:
- Lines rising to the right have a positive slope.
- Lines falling to the right have a negative slope.
- Lines parallel to the x-axis (or horizontal) have a slope of 0.
- Lines parallel to the y-axis (or vertical) have a slope that is undefined.
You can calculate the slope of a line by determining the rise and run between any two points on a line. The reason for this is that the slope of a line is constant. The formula for the slope of a line given two points on the line with coordinates (x1, y1) and (x2, y2) is
![]() , where m is the slope
, where m is the slope
Watch the video Investigating Slope to see how you can use points to determine the rise and run of a line.

1.3. Discover
Module 6: Proportional Reasoning
Discover
As you saw in Lesson 1, rates can be represented in many different ways, including as a ratio and pictorially. The representation you choose depends on your purpose. A graph can also be used to represent and compare rates.
Try This 1
You should place your completed Try This activities in your course folder. Your teacher may ask to see your completed Try This activities.
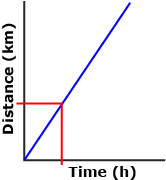
Use the “Distance-Time Graphs” gizmo to investigate graphs of a runner’s position versus time for a 40-m dash.

Screenshot reprinted with permission of ExploreLearning
Ensure that the number of points is set to 2. Working with Runner 1, the “Show graph” and “Show animation” boxes should be checked. Drag the green arrow on the graph to the left. Look at the animation of the runner at the bottom. What do you notice about the position of the runner in the race and the time on the stopwatch as the green line is moved?
- What does the slope of the graph of Runner 1 represent?
- Add in a second runner by clicking on the “New” button next to Runner 2. Again, make sure the “Show graph” and “Show animation” boxes are checked. You can click on the new button several times to see different lines plotted on the graph for this runner. What does it mean when the second runner’s line does not start at (0, 0)? Hint: Look at the position of the runner in the animation below the graph.
- Now move the green line to the left again and watch the animation. What happens? Compare the graphs of each runner to their respective positions during the race. From the graph, identify the following:
- Who will finish the race first? How can you tell this from the graph?
- Who is the slower runner? How can you tell this from the graph?
- What is happening in the race when the graphs of the two runners intersect?
- Who will finish the race first? How can you tell this from the graph?
- Complete the “Assessment Questions” located below the race track. Choose “Check Your Answers” when you have finished answering the questions.
1.4. Explore
Module 6: Proportional Reasoning
Explore
In Discover you saw how a graph could be used to compare two rates: the speed of two runners. The slopes of the distance-time graphs represented the speeds of the runners.
Recall that the slope of a line can be calculated by determining the rise and run between any two points on a line.
For a distance-time graph, this means dividing the change in distance by the change in time.
![]()
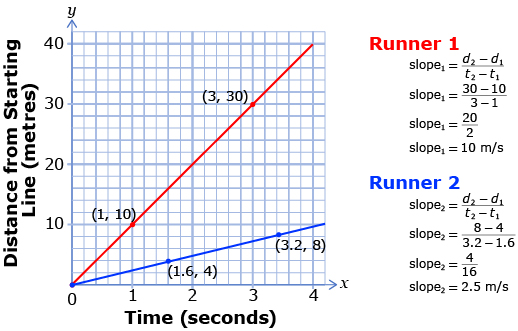
A lot can be learned from examining the graph. First, the slope of the graph for Runner 1 is steeper than Runner 2. That means that Runner 1 had a faster speed. Each of the graphs is linear (i.e., a straight line). This means that the rate is constant. In other words, the runners maintained a constant speed throughout the race.
From the calculations, Runner 1 had an average speed of 10 m/s. Runner 2 had an average speed of 2.5 m/s. Runner 1 was 7.5 m/s faster than Runner 2.
In this example, speed is a rate of change expressed in metres per second (m/s). Since the numerical value of the second term is equal to one (1 second), speed is a unit rate.
Try This 2
Use the “Slope as a Rate of Change” applet to compare the speed of a race car as it runs laps on a track. First, click on “Rise, Run, and Slope.” Then choose “Slope as a Rate of Change.”

Read “Example 2: Connecting the slope of a line segment to a rate” on pages 446 to 448 of your textbook. Note how Gilles uses the slope of each line segment to help him come up with a reasonable scenario.
Self-Check 1
Complete “Check Your Understanding” questions 3, 12, and 13 on pages 450 to 452 of your textbook. Answer
1.5. Explore 2
Module 6: Proportional Reasoning
The fuel efficiency of vehicles is an important consideration when deciding which vehicle to take on a long trip. For instance, when moving, a person may use the vehicle’s fuel consumption rating to determine whether it is cheaper to drive the vehicle or to ship the vehicle to the new location.
A vehicle’s fuel consumption rating, or fuel efficiency, is represented as a rate. Fuel consumption ratings are given as L/100 km or mi/gal (miles per gallon). A vehicle has two fuel consumption ratings: one for city driving, which includes a lot of stop and go, and one for highway driving. In Canada, all new light-duty vehicles have a standardized EnerGuide Label that highlights the manufacturer’s approved fuel-consumption ratings for the vehicle. The label shows the city and highway fuel-consumption ratings as well as the estimated annual fuel cost for the vehicle.
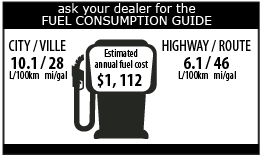 |
Did You Know? Natural Resources Canada has a fuel-consumption ratings tool that lets you compare the fuel efficiency of different makes and models of vehicles available in Canada. For more information, or to use the tool, type the words “NRC Fuel Consumption Ratings” into an Internet search engine. |
Try This 3

Comstock/Thinkstock
Rajesh and Kunal’s parents have a four-door car and a minivan. They are trying to determine which vehicle to take on their move and which vehicle to ship. The drive to the new city is 2400 km of mostly highway driving. It will cost about $2000 to ship either of the vehicles to their new city. Use the Gas Used Versus Distance Driven graph to answer the following questions.
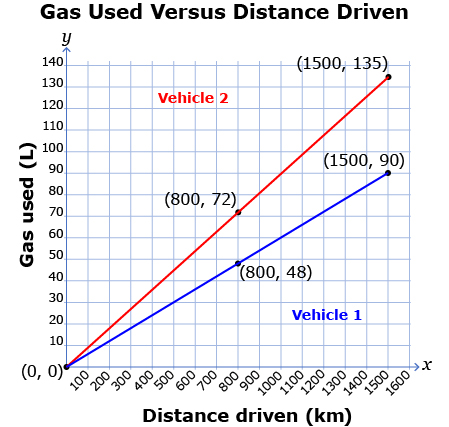
- Determine the slope of each graph. Include units in your answer.
- What does the slope of each graph represent?
- Vehicle 1 has a fuel-tank capacity of 70 L. How many kilometres can Vehicle 1 go on one tank of gas?

- Vehicle 2 has a fuel-tank capacity of 76 L. How many kilometres can Vehicle 2 go on one tank of gas?
- Which line on the graph represents the car? Which line on the graph represents the minivan? Justify your decision.
- Based on your results, which vehicle should the family drive to their new city? Which vehicle should they put on the moving truck? Justify your answer.
- What other factors would you need to consider, besides fuel efficiency, when deciding which vehicle to drive and which vehicle to ship?
Share 1
Compare your responses from Try This 3 with another student or appropriate partner. Explain your reasoning for the vehicle you suggested the family drive on their move and the vehicle that should be shipped.
1.6. Explore 3
Module 6: Proportional Reasoning
When comparing the fuel efficiency of two vehicles, the vehicle with the lower fuel-consumption rate will use less gas to drive the same distance. The vehicle will also go a further distance on less gas. If you are looking at the fuel-consumption ratings that use the rate of L/100 km, you want a lower value. If the comparison of miles per gallon is used, a higher rate is preferred because this means you can go a greater distance on less fuel.
In Try This 3 you used a graph to compare the fuel efficiency of two vehicles. Fuel efficiency can also be compared using unit rates.
Read “Example 3: Solving a problem involving rates” on pages 448 and 449 of your textbook. As you read over the example, think about the following:
To convert a rate that is
L/km to a rate expressed in L/100 km, multiply each term by 100. For example, 0.053 L/km is equivalent to 5.3 L/100 km.
- Which solution do you prefer: Katrina’s solution using a graph or Grant’s solution that uses unit rates?
- What are the advantages of using a graph?
- What are the advantages of using unit rates?
- Did the car achieve the manufacturer’s fuel consumption rating of 7.6 L/100 km on the first and/or second leg of the trip?
Self-Check 2
- Complete “Practising” questions 10 and 11 on page 451 of your textbook. Answer
- Complete “Closing” question 16 on page 453 of your textbook. Answer
1.8. Lesson 2 Summary
Module 6: Proportional Reasoning
Lesson 2 Summary
As the demand for more environmentally friendly vehicles increases, the demand for more fuel-efficient vehicles also increases. Fuel consumption or fuel efficiency is expressed as a rate—usually in litres per 100 km or miles per gallon. Graphs can be used to represent and compare the fuel efficiency of different vehicles.
Graphs that show the relationship between two quantities have a slope that represents the average rate of change for those quantities. The slope of a graph that represents a rate of change is a unit rate. For example, on a distance-time graph, the slope represents the speed of the object. Speed, when expressed as m/s or km/h, is a unit rate.
Graphs are another strategy that can be used to represent and compare rates. In Lesson 3 you will use graphs and other strategies to analyze and solve problems that involve rates.