Lesson 3
| Site: | MoodleHUB.ca 🍁 |
| Course: | Math 20-2 SS |
| Book: | Lesson 3 |
| Printed by: | Guest user |
| Date: | Tuesday, 30 December 2025, 9:24 AM |
Description
Created by IMSreader
1. Lesson 3
Module 6: Proportional Reasoning
Lesson 3: Solving Rate Problems
Focus

Jupiterimages/Photos.com/Thinkstock
Have you ever had to exchange your money for a different currency? Maybe you have travelled to another country and needed to buy some of that country’s currency? Perhaps you have relatives in another country and they have sent you some of their money? Maybe you had to exchange Canadian dollars for currency in peso, pound, euro, zloty, franc, real, lev, yuan, colon, birr, gourde, rupee, shilling, or yen.
You have probably heard news anchors on TV mention how the Canadian dollar rose or fell against the U.S. dollar or another nation’s currency on any given day. As you saw in Lesson 1, the value of a nation’s currency is expressed as a rate that compares it to another nation’s currency. For example, the following rates show how much one Canadian dollar was worth on a given day compared to each of the following currencies:
- 1:00 Cdn : 1.004 17 U.S.
- 1.00 Cdn : 0.628 190 GBP
- 1.00 Cdn : 12.1396 MXN
- 1.00 Cdn : 45.5222 INR
Did You Know?
So, on this particular day, one Canadian dollar is worth 1.004 17 U.S. dollars, 0.628 190 Great Britain pounds, 12.1396 Mexican pesos, and 45.5222 Indian rupees. Exchange rates are constantly changing as they are determined by the market.
When going on a vacation or moving to a different country, having that nation’s currency is important. People also take the exchange rate into account when they are making purchases in another country. If you need to transfer a large amount of funds from one currency to another, the exchange rate is particularly important. A small change in the exchange rate can have a big influence on the total cost of exchanging a large amount of money.
This lesson will help you answer the following inquiry question:
- How can different strategies be used to analyze and solve problems that involve rates?
Assessment
- Lesson 3 Assignment
- Module 6 Project: Part 1
All assessment items you encounter need to be placed in your course folder.
Save a copy of the Lesson 3 Assignment to your course folder. You will receive more information about how to complete the assignment later in this lesson.
In this lesson you will also be directed to work on Part 1 of the Module 6 Project. You will find a link later in this lesson that will take you to the Module 6 Project.
Materials and Equipment
- graphing calculator
1.1. Explore
Module 6: Proportional Reasoning
Explore
Currency is not the only unit that might be different in another country. For instance, some countries use different systems of measurement. When making a purchase of an item in a different country, you may have to apply multiple rates to make an accurate comparison.

Polka Dot/Thinkstock
Canada has been in the process of converting to the metric system since 1970. The Canadian government created the Metric Commission in 1971 to plan and prepare for the conversion process. With changes in government the process stalled. Forty years later the conversion is not complete. You can see some simple examples where imperial measurement is still used in your grocery store. Can you think of other examples where people still use the imperial system?
For a look back at the reaction to “metrification,” check out the CBC archives. An Internet search using the keywords “Canada Converts to Metric” is another option. You can also talk with your parents or elders in your community about the switch. Which unit of measurement do your parents or elders most commonly use in different situations: imperial or metric?
Read “Example 1: Solving a problem that involves multiple rates” on page 454 of your textbook. While reading this example, consider the following questions: Why did Jeff convert the volume of the gas tank to U.S. gallons? What other strategy could he have used to determine which option was more economical?
1.2. Explore 2
Module 6: Proportional Reasoning
The strategy that Jeff used to compare the cost of filling up his truck in Canada versus filling his truck up in the United States is similar to the unit rate multiplication strategy you used in previous lessons to solve problems. The difference was that, in Jeff’s solution, multiple rates needed to be used. To solve the problem, Jeff had to convert the volume of the gas tank to the same unit of measurement and the cost of gas to the same currency.
Self-Check 1
Complete “Practising” questions 13 and 15 on page 460 of your textbook. Answer
1.3. Explore 3
Module 6: Proportional Reasoning
A lot of the problems you have solved in this module have required you to use rates. For instance, you compared rates to find the best buy or to do conversions. Sometimes you need to use rates to solve for an unknown.
Read “Example 3: Reasoning to solve a rate problem” on page 456 of your textbook. Consider the following: What strategies did Mila and Joe use to determine how many boxes of dessert squares should be purchased? Which strategy do you prefer?
![]()
The strategy of unit analysis involves using conversion factors to reduce to a single unit in the second term (or denominator) of the rate.
You can solve a rate problem that involves an unknown by using a variety of strategies. Mila used unit analysis to solve her problem while Joe decided to use estimation. Unit analysis is also useful for converting from one unit to another. Consider the following situation.
Esther was training for a race and bought a pedometer to track her jogging speed. She was disappointed to see that the pedometer only displayed her speed in m/s. Her coach had been tracking Esther’s progress and recording her speed in km/h.
Esther decided to note her speeds from her pedometer and then do the conversions to km/h. Her top speed with her coach had been 6 km/h. With her new pedometer, Esther’s top speed had been 2 m/s. Had her speed increased, decreased, or stayed the same?
Esther can convert from km/h to m/s or vice versa. She decided to convert from m/s to km/h.
![]()
Then she can convert to km/h by dividing by 1000.
So, Esther ran faster with her pedometer than with her coach.
1.4. Explore 4
Module 6: Proportional Reasoning
Functions can also be written to help solve problems involving rates. Linear functions represent situations where a rate of change is constant.

Comstock/Thinkstock

Stockbyte/Thinkstock
Consider the following situation.
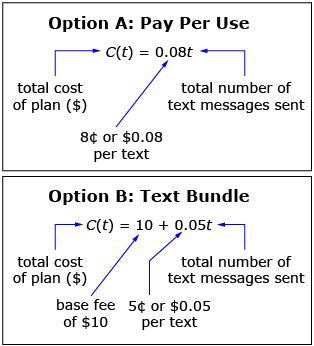
Rajesh’s sister, Akuti, is preparing for the move by finding a new cellphone plan. She intends to keep in contact with her friends through texting. She has two choices for an add-on texting plan: a pay-per-use plan and a texting bundle. Both plans only charge for outgoing text messages. Incoming texts are free. You can view Akuti’s Options to see the two plans.

1.5. Explore 5
Module 6: Proportional Reasoning
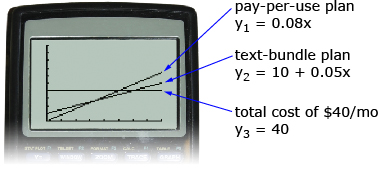
Akuti could also have used a graph to determine which plan was the better deal. Recall that linear functions can be entered into your graphing calculator or into a spreadsheet program. Begin by entering the two equations that Akuti developed to represent the two plans.
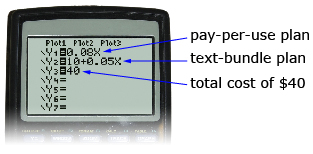
Since Akuti has a limit on what she can spend on the texting plan, you will also enter a third equation to represent that limit: Y3 = 40.
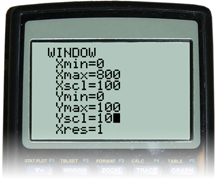
Before pressing the “Graph” button, you need to ensure that your window settings are set up correctly. This ensures that all three lines will show up on the screen.
- The domain of the graphs—represented by t in your equation—has to be greater than zero. (You can’t send a negative number of text messages.)
- The range of the graphs, which represents the total cost of the plan, has to be greater than zero.
A potential window setting is shown for a maximum of 800 text messages sent and a maximum cost of $100.
Now you can press the “Graph” button to show the graphs of the three lines.
From the previous graph you can determine which plan allows the most text messages to be sent for $40. The values on the x-axis (the horizontal axis) represent the number of text messages sent. The graph that intersects the horizontal line, Y3 (total cost of $40) at a higher value on the x-axis (further to the right), shows the plan that is the better buy. This plan allows the most text messages for $40.
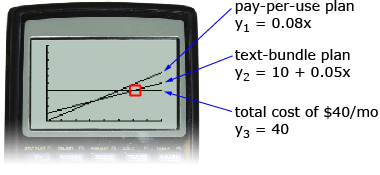
You can see from the calculations Akuti made, and from the graph, that the text-bundle plan is the better deal for Akuti. To determine how many more text messages can be sent, you can use the intersect feature on your graphing calculator.

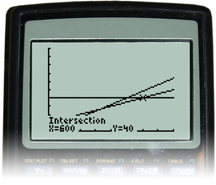
The text-bundle plan allows for 100 more text messages to be sent for $40 than the pay-per-use plan.
Try This 1
Using your graphing calculator, determine the maximum number of texts that Akuti could send in order for the pay-per-use plan to be the less expensive option. Note that, in this case, Akuti doesn’t have a $40-a-month budget.
You will begin with the same two equations since the cellphone plans are the same, but there is not a limit on what she will spend. The key to this question is to use your graph to find the point at which the pay-per-use plan costs less. Answer
Share 1
Working with a partner, discuss what other factors Akuti would need to consider before deciding on a texting plan.
1.6. Explore 6
Module 6: Proportional Reasoning
Read “Example 4: Solving a problem that involves different rates” on pages 456 to 458 of your textbook. April used a function while Joanna used equivalent ratio. Which strategy do you prefer?
Self-Check 2
- Complete “Check Your Understanding” question 1 on pages 458 and 459 of the textbook. Answer
- Complete “Practising” questions 3, 5, 12, and 18 on pages 459 to 461 of your textbook. Answer
The following questions are optional if you feel you need more practice solving rate problems.
- Try “Practicing” questions 7, 8, 11, and 16 on pages 459 to 461 of your textbook. Answer
- Try “Extending” questions 19 and 20 on page 461 of your textbook. Answer
- Try “Extending” question 18 on page 453 of your textbook. Answer
Did you know that an understanding of rates can help you to solve some types of puzzles? Well, now’s your chance to use your problem-solving strategy to analyze and solve a rate puzzle!
Share 2
With a partner, complete “Applying Problem-Solving Strategies” on page 462 of the textbook.
You may find it helpful to draw the diagram on a piece of grid paper. As you work through your solution, consider the following questions:
- How does the ruler on the left relate to the diagram? How does the ruler relate to a graph?
- What math have you learned that you can apply to this question?
Use the “Mid-Chapter Review: Frequently Asked Questions” on page 463 of your textbook to supplement or start your notes organizer for Module 6. For instance, consider the following:
- What strategies can you use to compare rates?
- What strategies can be used to solve a problem involving a rate?
1.7. Connect
Module 6: Proportional Reasoning
Connect
Lesson Assignment
Complete the Lesson 3 Assignment that you saved to your course folder.
Project Connection
You are now ready to complete the first part of the project for this module. Open the Module 6 Project and start preparing to be moved!
Going Beyond
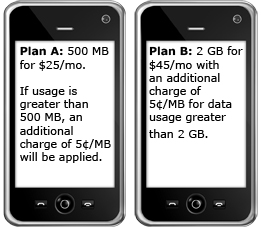
Many mobile phone plans have a base fee and then charge an overage fee if you go beyond a certain number of minutes, text messages, or data downloads. For example, the following are two plans for data usage for a smartphone.
iStockphoto/Thinkstock
Wireless data is billed according to the volume of data that is sent or received, not for the amount of time that you are connected. The following are estimates of the amount of data used for various activities on a smartphone.
- 1 e-mail (text only) = 0.022 MB
- 1 e-mail with word processor, spreadsheet, or slideshow attachment = 0.28 MB
- 1 e-mail with photo attachment = 0.293 MB
- 1 instant message (50 characters in length) = 0.024 MB
- 1 web page (based on average of top 25 most visited websites) = 0.171 MB
- 1 minute of streaming video = 1 MB
- 1 song (4 minutes in length) = 4 MB
- 1 application (average based on top 20 most popular downloads) = 4 MB
Are you paying for more data than you need? Are you downloading more than your plan allows and paying the price? Choosing the data plan that is best for you means determining approximately how much data you use per month.
Depending on how much you use your phone, you might first want to determine data usage per day or per week. You may be able to look at your last bill to determine your average monthly use. Then you can look at the different data plans that are available and find the plan that is best suited for you and your data needs.
1.8. Lesson 3 Summary
Module 6: Proportional Reasoning
Lesson 3 Summary
As you have seen in this lesson, there are a variety of strategies you can use to solve problems involving multiple rates. These same strategies work when using rates to solve for an unknown. You might
- use unit analysis
- estimate using proportional reasoning
- use equivalent ratios
- use unit rates
- use a function
- use a graph
Depending on the situation, choose the strategy that will work the best for you.
You may use these math skills many times in daily life.
- Being able to convert between the imperial and metric systems is a critical skill as Canadian society has not fully changed to the metric system.
- Since Canada shares close ties with the Unites States, currency conversion may be needed if you purchase something from the U.S. over the Internet or plan to make a trip there.
- Many people have cellphones, so analyzing phone plans to save money is important.
Whether you are watching television, surfing the Internet, or shopping for groceries, sound math skills help you make wise consumer decisions.