Lesson 5
| Site: | MoodleHUB.ca 🍁 |
| Course: | Math 20-2 SS |
| Book: | Lesson 5 |
| Printed by: | Guest user |
| Date: | Tuesday, 30 December 2025, 9:53 AM |
Description
Created by IMSreader
1. Lesson 5
Module 6: Proportional Reasoning
Lesson 5: Scale Diagrams
Focus

billboard and hamburger: istockphoto
As you travel down most urban roads or rural highways, you will likely see one of the most high-impact outdoor advertising methods available to advertisers: billboards.
Billboards provide companies with a larger-than-life way to promote products to thousands of people on a daily basis. They are designed to catch the attention of customers and leave a memorable impression very quickly. Unlike other advertising methods, billboards have only the few seconds it takes for the commuter to pass to make an impact.
Obviously, working on a full-sized mock-up of a billboard in the design planning stages would be a huge task, not to mention very expensive and time consuming. So designers use scale diagrams to produce accurate and proportional representations. Scale diagrams provide an accurate sample and allow for changes to be made efficiently and inexpensively and help create advertisements with impact and visual appeal.
This lesson will help you answer the following critical questions:
- How can scale diagrams and models be used to determine unknown measurements?
- How can scale factor be used to create scale diagrams?
Assessment
- Lesson 5 Assignment
- Module 6 Project: Part 2
All assessment items you encounter need to be placed in your course folder.
Save a copy of the Lesson 5 Assignment to your course folder. You will receive more information about how to complete the assignment later in this lesson.
In this lesson you will also be directed to work on Part 2 of the Module 6 Project. You will find a link later in this lesson that will take you to the Module 6 Project.
Materials and Equipment
- calculator
- 1-cm Grid Paper or 2-cm Grid Paper
- ruler or straightedge
1.1. Explore
Module 6: Proportional Reasoning
Explore
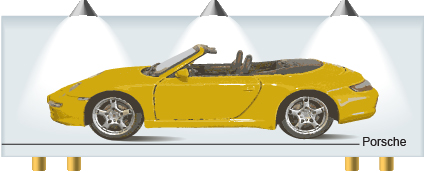
Scale is also used extensively in the vehicle industry and in toy car development. During product development, scale is used to create prototypes that allow designers to see how the vehicle will eventually look. This allows manufacturers to identify areas that need more refining without spending a lot of money to build the full-scale version of the vehicle. Scale diagrams and models allow toy car developers to produce proportional representations of these cool new cars.
Watch the video “Designing Toy Cars” to see how a professional toy designer uses scale to create accurate replicas of the coolest cars on the road. To access the video, type “Futures Video Designing Toy Cars” into your favourite Internet search engine.
Recall that a scale diagram or model may be an enlargement or reduction of an actual shape or object. A scale diagram must contain a scale that specifies the ratio of the size of the image on the drawing to the actual size. Without scale, the diagram is just another drawing and does not ensure that proportions will be maintained.
Consider the following model of a car.
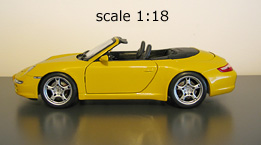
The model car has a scale of 1:18. This means that the actual linear dimensions of the car are 18 times larger than the linear dimensions of the model.
In Lesson 4 you determined scale factor by relating the diagram or model measurement to the actual measurement.
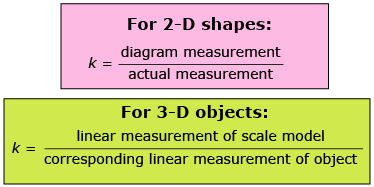
All measurements on a scale diagram or model are drawn to the same scale. Therefore, if you know the scale factor, you can determine any of the actual dimensions of the shape or object.
For example, the model car has a length of 24.78 cm. The scale of the model is 1:18. To determine the actual car’s length you can multiply the scale factor or set up a proportion.
Strategy 1: Use Scale Factor
24.78 cm × 18 = 446.04 cm
Strategy 2: Use a Proportion
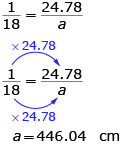
The length of the actual car is 446.04 cm.
Read “Example 2: Determining actual dimensions from a scale model” on page 485 of your textbook. What strategy did Esmerelda use to determine the dimensions of the real tractor?
Self-Check 1
The yellow car is the star of a billboard advertising campaign. Before the billboard was created, a scale diagram of the billboard was drawn by the advertising company. The scale on the diagram is 1:45.
When you are comparing dimensions in a ratio, it is important that the units are the same. You can convert both measurements to either centimetres or metres, depending on what you prefer to work with.
- The length of the car on the scale diagram is 12.39 cm. Determine the length of the car on the billboard.
- The height of the car on the billboard is 162.5 cm. What is the height of the car on the scale diagram?
- The car has a height of 1.30 m and a length of 4.46 m in real life. What is the scale factor between the image of the car on the billboard and the real car? Is the car on the billboard an enlargement or a reduction of the real car? Justify your answer.
- The maximum length that the image of the car can be on the billboard is 6 m. What is the largest factor that can be used to enlarge the image of the car from the original scale diagram?
Answer
Read “Example 3: Enlarging from a scale diagram to determine actual dimensions” on page 486 of the textbook if you feel you would benefit from another example of using scale diagrams to determine actual dimensions
Self-Check 2
1.2. Explore 2
Module 6: Proportional Reasoning

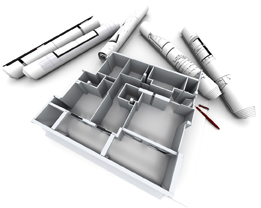
iStockphoto/Thinkstock
Scale diagrams are also useful to help visualize house plans. It is impossible to draw a house to its actual measurements. So the measurements are reduced by a scale factor, and a scale diagram is drawn. Contractors use scale diagrams or blueprints to provide tradespersons with accurate and specific measurements. Scale diagrams and 3-D models also provide a proportional representation of what the final structure will look like.
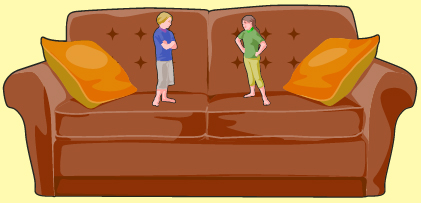
Scale diagrams are also helpful for determining how to arrange furniture in a room—or for determining whether or not the furniture will even fit! It is much less backbreaking to move a couch on a scale diagram than to move the actual couch numerous times.

Comstock/Thinkstock
As you know, Rajesh and his family are moving to a smaller house in a new city. Rajesh wants to figure out whether all of his furniture will fit in his smaller new room. Rajesh has not seen his room at the new house yet. His parents, however, did give him a copy of the floor plan. Since floor plans are not always drawn to scale, Rajesh decides to make a scale diagram of his new room. This way, he will be able to accurately determine whether his furniture will fit and how best to position it.
Try This 1
Use the applet Rajesh’s Room to help Rajesh draw a scale diagram of his new room and help him determine whether all his furniture will fit.
Read “Example 2: Drawing a 2-D scale diagram that requires an enlargement” on pages 468 and 469 of the textbook. Why do the angles within the smaller circle not change when the logo is enlarged?
Self-Check 3
1.3. Explore 3
Module 6: Proportional Reasoning
So far, you have looked at drawing scale diagrams of 2-D shapes. Scale diagrams can also be used to represent a 3-D object.
Did You Know?
In the movies Honey, I Shrunk the Kids and Honey, We Shrunk Ourselves scale models were used to make people look small. For example, a giant ant was created for the movie Honey, I Shrunk the Kids. As many as 12 people were required to operate cables in a marionette-like fashion in order to make the model ant move. Alongside this giant ant, actors appeared to be shrunken.
In the movies, the inventor of the electro-magnetic shrink ray was played by Canadian actor Rick Moranis. He’s at it again in the movie Honey, I BLEW UP the Kid, but this time he creates a machine that turns his toddler son into a giant who strolls through Las Vegas. How would the scale models used in Honey, I BLEW UP the Kid be different than the scale models used in the shrunk movies?
Read “Example 4: Drawing a scale diagram of a 3-D object” on pages 487 and 488 of the textbook. Why do the angles within the smaller circle not change when the logo is enlarged? Why does Celine draw a side view and a front view of the pipe?
Self-Check 4
1.4. Connect
Module 6: Proportional Reasoning
Connect
Lesson Assignment
Complete the Lesson 5 Assignment that you saved to your course folder.
Project Connection
You are now ready to complete the second part of the project for this module. Open the Module 6 Project, and refer to the instructions in Part 2 of the project.
Going Beyond

iStockphoto/Thinkstock
Scale diagrams are used in blueprints and maps.
If you have access to house blueprints, either your own or some you found online, see if you can determine the room dimensions based on the scale provided on the blueprint. Or use a software program to create a scale diagram of your room or another structure of interest to you. Some software programs even have 3-D rendering capabilities that let you take a virtual tour of your design.
Alternatively, you may find it interesting to test one of the map pages online and confirm that the map you select has its distances correct between two known cities or landmarks.
1.5. Lesson 5 Summary
Module 6: Proportional Reasoning
iStockphoto/Thinkstock
Lesson 5 Summary
Sometimes, a design needs to be created in larger-than-life sizes. Or a large object may need to be viewed in a more manageable size. Designers use scale to produce accurate and proportional representations of shapes and objects.
By relating the diagram measurement to the actual measurement, scale can be determined. Since all items on a scale diagram are drawn to the same scale, you can determine the real dimensions of the object using either the scale or a proportion if you know the scale factor.