Lesson 1
| Site: | MoodleHUB.ca 🍁 |
| Course: | Math 20-1 SS |
| Book: | Lesson 1 |
| Printed by: | Guest user |
| Date: | Thursday, 4 December 2025, 2:15 AM |
Description
Created by IMSreader
1. Lesson 1
Module 3: Quadratic Functions
Lesson 1: Investigating Quadratic Functions
Focus
iStockphoto/Thinkstock
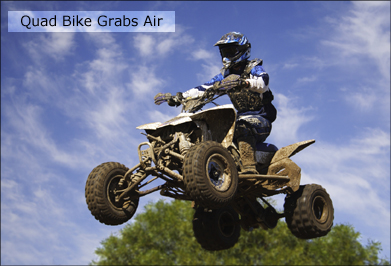
In this lesson you will learn about the vertex form of the quadratic function, y = a(x − p)2 + q. You will notice patterns between the values of a, p, and q in the function and the shape and position of the graph. You will then be able to predict and graph the path of a quad in a jump, a thrown football, a flying hockey puck, or any real-world projectile example.
Outcomes
At the end of this lesson you will be able to
- explain why y = a(x − p)2 + q is a quadratic function
- compare the graph of y = ax2 to the graph of y = x2, and state rules about the effect of a
- compare the graph of y = x2 + q to the graph of y = x2, and state a rule about the effect of q
- compare the graph y = a(x − p)2 to the graph of y = x2, and state a rule about the effect of p
Lesson Questions
You will investigate the following questions:
- How do the values of a, p, and q affect the appearance and placement of the graph of the function y = a(x − p)2 + q?
- What are the characteristics of quadratic functions and their graphs?
Assessment
Your assessment may be based on a combination of the following tasks:
- completion of the Lesson 1 Assignment (Download the Lesson 1 Assignment and save it in your course folder now.)
- course folder submissions from Try This and Share activities
- additions to Module 3 Glossary Terms and Formula Sheet
- work under Project Connection
Self-Check activities are for your own use. You can compare your answers to suggested answers to see if you are on track. If you are having difficulty with concepts or calculations, contact your teacher.
Materials and Equipment
You will need a graphing calculator and graph paper.
1.1. Launch
Module 3: Quadratic Functions
Launch
Do you have the background knowledge and skills you need to complete this lesson successfully? This section, which includes Are You Ready? and Refresher, will help you find out.
Before beginning this lesson, you should be able to
- complete a data table for a given function
- draw a graph from a table of values
- identify domain and range
- identify the x- and y-intercepts of a graph
1.2. Are You Ready?
Module 3: Quadratic Functions
Are You Ready?
Complete these questions. If you experience difficulty and need help, visit Refresher or contact your teacher.
-
- Complete a data table like the one shown for the quadratic function y = x2 + 2.
x
0 1
2 3 −1 −2 0.5 y
Answer
- Draw a graph from the table of values in question 1.a. Join the data points in a smooth curve. You can use the graph paper provided, or you can search the Internet for a graphing tool.
Answer
-
Identify the x- and y-intercepts, if any, by looking at the graph. Answer
- Complete a data table like the one shown for the quadratic function y = x2 + 2.
-
- Fill in a data table like the one shown for the quadratic function y = −5(x − 1)2 + 5, which describes the path of a quad during a jump.
x
0 1
2 0.5 1.5 y
Answer
- Draw a graph from the table of values in question 2.a. Join the data points in a smooth curve. Answer
-
Identify the x- and y-intercepts, if any, by looking at the graph. Answer
- Fill in a data table like the one shown for the quadratic function y = −5(x − 1)2 + 5, which describes the path of a quad during a jump.
-
Define domain and range and give an example of each. Answer
How did the questions go? If you feel comfortable with the concepts covered in the questions, skip forward to Discover. If you experienced difficulties, use the resources in Refresher to review these important concepts before continuing through the lesson.
1.3. Refresher
Module 3: Quadratic Functions
Refresher
Use Graph to review how to complete a data table of values and draw a graph for a given function.

Review how to identify domain and range. Work through Concept Development Domain and Range, which offers information, practice questions, and feedback. You will need to click on Domain and Range on two different screens.
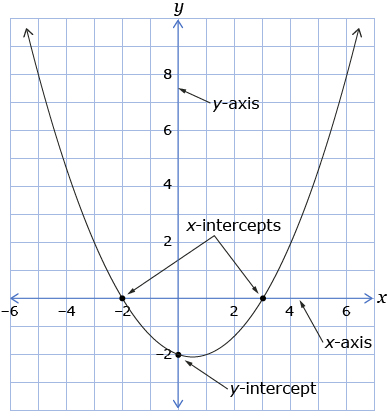
Practise identifying the x- and y-intercepts of a graph. An x-intercept of a graph is the x-coordinate of a point where the graph crosses the x-axis. A y-intercept of a graph is the y-coordinate of a point where the graph crosses the y-axis.
Go back to the Are You Ready? section, and try the questions again. If you are still having difficulty, contact your teacher.
1.4. Discover
Module 3: Quadratic Functions
Discover
The vertex form of a quadratic function was introduced in Focus. In this Discover section you will investigate the effects of changing the values of a, q, and p in the equation y = a(x − p)2 + q.
Try This 1
Open Quadratic Function (Vertex Form).
Part A: Investigation of a
- Use the a-slider to explore how the value of a in y = ax2 changes the shape of the graph. Make sure the parameters p and q are set to 0. You may use a chart similar to the one shown to record your observations.
a y = ax2 Observations or Sketch 9 y = 9x2 2 y = 2x2 1 y = 1x2 0.5 y = 0.5x2 0.2 y = 0.2x2 −0.2 y = −0.2x2 −0.5 y = −0.5x2 −1 y = −1x2 −2 y = −2x2 −9 y = −9x2
- Use the q-slider to explore how the value of q in y = x2 + q changes the position of the graph. Make sure the parameter a is set to 1 and p is set to 0. You may use a chart similar to the one shown to record your observations.
q y = x2 + q Observations or Sketch 6 y = x2 + 6 3 y = x2 + 3 0.5 y = x2 + 0.5 0 y = x2 −0.5 y = x2 − 0.5 −3 y = x2 − 3 −6 y = x2 − 6
- Use the p-slider to explore how the value of p in y = (x − p)2 changes the position of the graph. Make sure the parameter a is set to 1 and q is set to 0. You may use a chart similar to the one shown to record your observations.
p y = (x − p)2 Observations or Sketch 6 y = (x − 6)2 3 y = (x − 3)2 0 y = x2 −3 y = (x + 3)2 −6 y = (x + 6)2
![]() Save your responses in your course folder.
Save your responses in your course folder.
1.5. Discover 2
Module 3: Quadratic Functions
Share 1
Based on your observations from Try This 1, discuss the following questions with a partner or group.
- How do the width and orientation of the graph change as the value of a changes? Describe the pattern you saw.
- How does the position of the graph change as the value of q changes? Describe the pattern you saw.
- How does the position of the graph change as the value of p changes? Describe the pattern you saw.
- Summarize your discussion by creating three general rules about the effects of a, p, and q on y = a(x − p)2 + q. You might find the chart shown provides a convenient way to summarize your understandings.
Variable Changed in y = a(x − p)2 + q What You Noticed (sketch, patterns) General Rule a p q
![]() Save your responses in your course folder.
Save your responses in your course folder.
1.6. Explore
Module 3: Quadratic Functions
Explore

Comstock/Thinkstock
In Try This 1 you had a chance to view many different graphs of quadratic functions. You may have noticed that the graph of a quadratic function is always a particular shape, called a parabola. In the photo shown, the thickest blue line can be described as having a parabolic shape. Can you see the similarity between the thick blue line and the graphs of quadratic functions you have observed so far in this lesson?
Try This 2

In Axis of Symmetry you will explore the shape of the parabola and its special features.
1.7. Explore 2
Module 3: Quadratic Functions
Maximum and Minimum Points
In Axis of Symmetry you may have noticed the pattern between a and the existence of a maximum or minimum point. The following chart summarizes the pattern.
| a | Sketch | Orientation | Maximum or Minimum |
| 3 |  |
opens upward | minimum |
| −3 |  |
opens downward | maximum |
You may have found that the value of a in y = a(x − p)2 + q has an effect on the parabola. The value of a in the equation influences the sharpness of the curve of the parabola. The table shown summarizes this effect.
| Value of a | Effect on Parabola |
As the value of a increases above 0 . . . |

. . . the curve goes from very wide to more and more narrow. |
As the value of a becomes increasingly negative . . . |

. . . the downward-opening curve becomes more and more narrow. |
You also explored the value of p and q in the vertex form of a quadratic function.
| q |
|
 |
| p |
|
 |
The shape of the reflector inside flashlights and automobile headlamps is a parabola. This shape formed by a quadratic function reflects the light out in a concentrated forward beam rather than in a scattered pattern.

Jupiterimages/Photos.com/Thinkstock
1.8. Explore 3
Module 3: Quadratic Functions
Self-Check 1
In Share 1, you created a table to organize your observed patterns and the three general rules you developed to describe the effect of a, p, and q on y = a(x − p)2 + q. Use your table and the graphs provided below to help answer the following questions.
1
|
2
|
3
|
4
|
5
|
6
|
7
|
8
|


- Match each equation with its graph.
-
Which of the graphs has a maximum value? What is that value? Answer
- What is the minimum value of graph 2? Answer
- What is the domain and range of graph 7? Answer
-
Why are all of the functions in Try This 1 considered to be quadratic functions? Answer
- Look at the equations in the chart. Without graphing, predict what each graph would look like.
Equation
y = a(x − p)2 + qWhat Does a Tell You About This Graph? What Does p Tell You About This Graph? What Does q Tell You About This Graph? y = 6(x − 3)2 + 5 y = 6(x − 3)2 − 4 y = 6x2 + 1 y = −6(x + 3)2 + 1 y = −0.5(x − 3)2 + 1
Answer
1.9. Explore 4
Module 3: Quadratic Functions
Add the quadratic function in vertex form to your copy of Formula Sheet. You will likely want to include a description of how a, p, and q affect the quadratic function.
![]() Resave Formula Sheet in your course folder.
Resave Formula Sheet in your course folder.
If you feel you have a solid understanding of how the shape and position of the parabola is influenced by the values of a, p, and q, go to Connect. Otherwise, complete Self-Check 2.
Self-Check 2
If you feel you need a bit more practice, complete questions 1 and 2 on page 157 of the textbook. Check your work in the back of the textbook. If you are still unclear about how to answer some questions, make sure you contact your teacher.
In future lessons make sure you use the quadratic function in the vertex form when deciding the position of the vertex. You will encounter other versions of the quadratic function that do not allow you to translate the numbers into vertex positions and orientations like the vertex form does.
1.10. Connect
Module 3: Quadratic Functions
In the Lesson 1 Assignment you will demonstrate your understanding of the lesson outcomes. You will apply the concepts and strategies you learned to new situations. You must show your work to support your answers.
Open your copy of Lesson 1 Assignment, which you saved in your course folder at the beginning of this lesson. Complete the assignment.
![]() Save all your work in your course folder.
Save all your work in your course folder.
Project Connection
You are now ready to begin Module 3 Project: Spray Park. Go to the Module 3 Project and read over all project requirements to become familiar with what you will be doing and how you will be assessed. Then complete the first step of the project, Activity 1: Part 1.
![]() Save all your work in your course folder.
Save all your work in your course folder.
1.11. Lesson 1 Summary
Module 3: Quadratic Functions
Lesson 1 Summary

Comstock/Thinkstock
In this lesson you investigated the following questions:
- How do the values of a, p, and q affect the appearance and placement of the graph of the function y = a(x − p)2 + q?
- What are the characteristics of quadratic functions and their graphs?
You studied a specific form of the quadratic function, the vertex form. A quadratic function has a variable raised to the second power—in other words, squared. You learned that the graph of the function a(x − p)2 + q forms a parabolic shape. You discovered the effect of the variables a, p, and q on the shape of the parabola.
You saw that a affects the shape and orientation of the parabola. The farther a is from 0, the narrower the parabola. The orientation of the parabola is also affected by a in the way summarized in the table.
| Direction of Opening | If a > 0, the parabola opens upward. |  |
| If a < 0, the parabola opens downward. |  |
The variable p determines where the parabola is on the x-axis, and q determines where the parabola is on the y-axis.

The parabolic shape and other terms described during this lesson are summarized in Summary of Common Characteristics of Quadratic Functions.
In the next lesson you will investigate how to determine the coordinates of the vertex of a quadratic formula and how to accurately sketch the graph. You will learn how to determine the x- and y-intercepts of the graph and write a quadratic equation from a graph.